📊 NIFTY 15-Min Trading Plan for 2-May-2025
(Chart-Based | Gap Opening = 100+ Points)
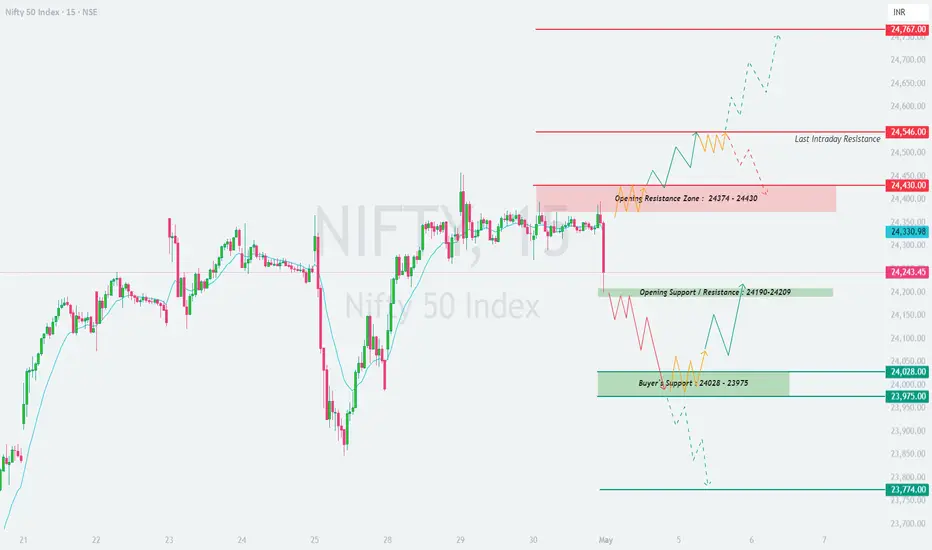
📍 Previous Close: 24,243.45
📌 Key Chart Zones & Levels:
🔴 Last Intraday Resistance: 24,546
🟥 Opening Resistance Zone: 24,430 – 24,374
🟩 Opening Support/Resistance Zone: 24,209 – 24,190
🟢 Buyer's Support Zone: 24,028 – 23,975
🔻 Extreme Downside Support: 23,774
🟥 Scenario 1: Gap-Up Opening (Above 24,430) 🚀
📚 Educational Insight: Gaps into resistance need extra caution. Early buyers often get trapped. Let the structure form before committing to trades.
🟨 Scenario 2: Flat Opening (Between 24,209 – 24,430) ⚖️
📚 Educational Insight: Neutral opens often give the best trade setups—but only after price reacts to zone boundaries. Wait for confirmation.
🟩 Scenario 3: Gap-Down Opening (Below 24,209) 📉
📚 Educational Insight: Gaps into demand zones offer great risk-reward, but only if supported by price confirmation. Avoid catching falling knives without structure.
🛡️ Options Risk Management Tips for Intraday Traders 🧠
📌 Summary & Conclusion 📝
✅ Gap-Up Opening: Watch 24,430–24,546 zone for reversal or breakout confirmation. Avoid aggressive longs without strength.
✅ Flat Opening: Neutral zone. Best setups may form after breakout/breakdown. Wait for edge-based reactions.
✅ Gap-Down Opening: Focus on 24,028–23,975 demand zone for reversal. Fresh shorts only below 23,975.
🎯 Trade with structure, confirmation, and risk control. Let price come to your plan—don’t chase emotions.
⚠️ Disclaimer:
I am not a SEBI-registered analyst. This analysis is intended solely for educational purposes. Please consult a certified financial advisor before making any trading or investment decisions.
(Chart-Based | Gap Opening = 100+ Points)
📍 Previous Close: 24,243.45
📌 Key Chart Zones & Levels:
🔴 Last Intraday Resistance: 24,546
🟥 Opening Resistance Zone: 24,430 – 24,374
🟩 Opening Support/Resistance Zone: 24,209 – 24,190
🟢 Buyer's Support Zone: 24,028 – 23,975
🔻 Extreme Downside Support: 23,774
🟥 Scenario 1: Gap-Up Opening (Above 24,430) 🚀
- [] If Nifty opens above 24,430, we are opening directly into the resistance supply zone. Avoid blind longs here as sellers may initially step in.
[] A sustainable bullish structure above 24,430 with follow-through candles and volume is a must for any breakout trade toward 24,546 (Last Intraday Resistance).
[] If price rejects the zone and slips back under 24,374, expect a pullback toward 24,330–24,243 zone.
[] For upside targets beyond 24,546, strong momentum must be visible. Only then can traders look for 24,767 as an extension level. - If the gap-up fades quickly and dips below 24,374, this is a warning for potential "gap fade" sell-off.
📚 Educational Insight: Gaps into resistance need extra caution. Early buyers often get trapped. Let the structure form before committing to trades.
🟨 Scenario 2: Flat Opening (Between 24,209 – 24,430) ⚖️
- [] A flat open puts Nifty inside the consolidation or decision zone. Expect both buyers and sellers to remain active here.
[] Avoid early trades in the first 15–30 minutes. Let price test the upper resistance (24,430) or lower support (24,209).
[] If Nifty breaks and sustains above 24,430, trend may attempt to reach 24,546 and possibly 24,767.
[] If Nifty dips below 24,209, a quick move toward 24,028 – 23,975 zone is possible. Look for bullish reversal candles here before buying. - Range-bound price action likely unless breakout or breakdown triggers with strength. Stay reactive, not predictive.
📚 Educational Insight: Neutral opens often give the best trade setups—but only after price reacts to zone boundaries. Wait for confirmation.
🟩 Scenario 3: Gap-Down Opening (Below 24,209) 📉
- [] A gap-down below 24,209 brings immediate attention to 24,028 – 23,975, a critical Buyer's Support Zone.
[] If price shows reversal patterns (bullish engulfing, hammer) near this zone with good volume, long entries with stops below 23,975 are favorable.
[] Failing to hold 23,975 will open gates to a deeper fall toward 23,774, the next visual support.
[] Avoid aggressive long trades just because prices are lower—structure matters more than location. - Breakdown below 23,975 with strong bearish candles can trigger fresh short trades targeting 23,774 or even lower zones.
📚 Educational Insight: Gaps into demand zones offer great risk-reward, but only if supported by price confirmation. Avoid catching falling knives without structure.
🛡️ Options Risk Management Tips for Intraday Traders 🧠
- [] Never trade naked options blindly in high IV zones. Use spreads (like bull call or bear put) for defined risk setups.
[] Don’t jump into trades in the first 5–10 minutes—option premiums are inflated. Let them settle.
[] Always trade with a defined stop loss. Avoid averaging losses.
[] Keep daily loss limits (e.g., 2% of capital) and walk away once hit. Discipline is key.
[] Avoid overleveraging OTM options; go ITM for directional conviction or use hedge legs.
[] Know when NOT to trade—sideways and indecisive markets destroy premium buyers. - Don’t convert intraday trades into swings emotionally. Stick to your plan.
📌 Summary & Conclusion 📝
✅ Gap-Up Opening: Watch 24,430–24,546 zone for reversal or breakout confirmation. Avoid aggressive longs without strength.
✅ Flat Opening: Neutral zone. Best setups may form after breakout/breakdown. Wait for edge-based reactions.
✅ Gap-Down Opening: Focus on 24,028–23,975 demand zone for reversal. Fresh shorts only below 23,975.
🎯 Trade with structure, confirmation, and risk control. Let price come to your plan—don’t chase emotions.
⚠️ Disclaimer:
I am not a SEBI-registered analyst. This analysis is intended solely for educational purposes. Please consult a certified financial advisor before making any trading or investment decisions.
Wyłączenie odpowiedzialności
The information and publications are not meant to be, and do not constitute, financial, investment, trading, or other types of advice or recommendations supplied or endorsed by TradingView. Read more in the Terms of Use.
Wyłączenie odpowiedzialności
The information and publications are not meant to be, and do not constitute, financial, investment, trading, or other types of advice or recommendations supplied or endorsed by TradingView. Read more in the Terms of Use.