📍 NIFTY – 1D Important Levels
🔹 Support Zones
22,200 – 22,300 → Immediate daily support
21,900 – 22,000 → Strong support zone; buyers likely to step in here
21,500 – 21,600 → Major support; breakdown may shift trend to bearish
🔹 Resistance Zones
22,700 – 22,800 → Immediate daily resistance
23,000 – 23,100 → Strong resistance; breakout may fuel next leg higher
23,400 – 23,500 → Major resistance; if crossed, long-term bullish momentum strengthens
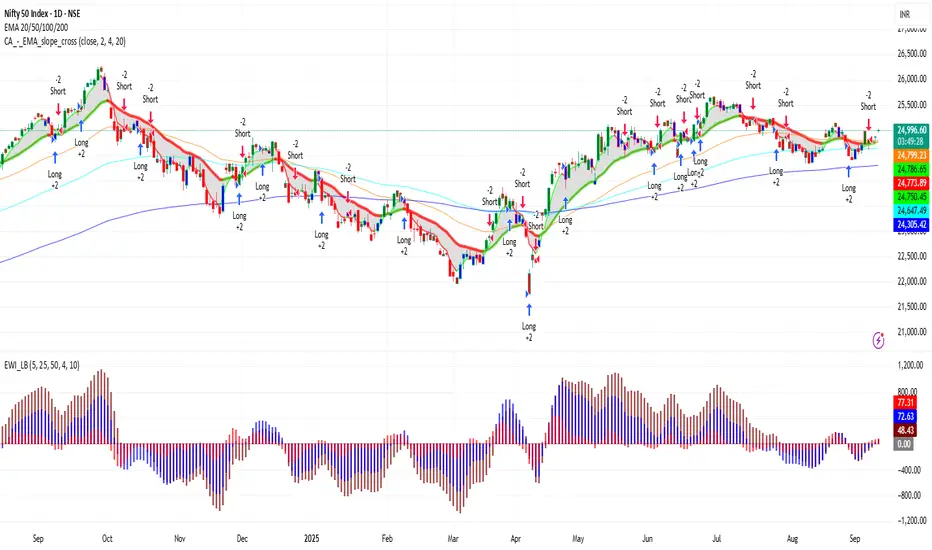
⚖️ Daily Trend Outlook
Nifty is currently in a bullish trend on the daily chart, making higher lows and sustaining above key moving averages.
Momentum remains strong as long as price holds above 22,200.
A breakout above 22,800 will likely push the index toward 23,000 – 23,500.
A breakdown below 22,200 could invite selling pressure toward 22,000 – 21,600.
🔹 Support Zones
22,200 – 22,300 → Immediate daily support
21,900 – 22,000 → Strong support zone; buyers likely to step in here
21,500 – 21,600 → Major support; breakdown may shift trend to bearish
🔹 Resistance Zones
22,700 – 22,800 → Immediate daily resistance
23,000 – 23,100 → Strong resistance; breakout may fuel next leg higher
23,400 – 23,500 → Major resistance; if crossed, long-term bullish momentum strengthens
⚖️ Daily Trend Outlook
Nifty is currently in a bullish trend on the daily chart, making higher lows and sustaining above key moving averages.
Momentum remains strong as long as price holds above 22,200.
A breakout above 22,800 will likely push the index toward 23,000 – 23,500.
A breakdown below 22,200 could invite selling pressure toward 22,000 – 21,600.
Powiązane publikacje
Wyłączenie odpowiedzialności
Informacje i publikacje przygotowane przez TradingView lub jego użytkowników, prezentowane na tej stronie, nie stanowią rekomendacji ani porad handlowych, inwestycyjnych i finansowych i nie powinny być w ten sposób traktowane ani wykorzystywane. Więcej informacji na ten temat znajdziesz w naszym Regulaminie.