Nat Gas looking oddly similar to BTC chart before a deep decline
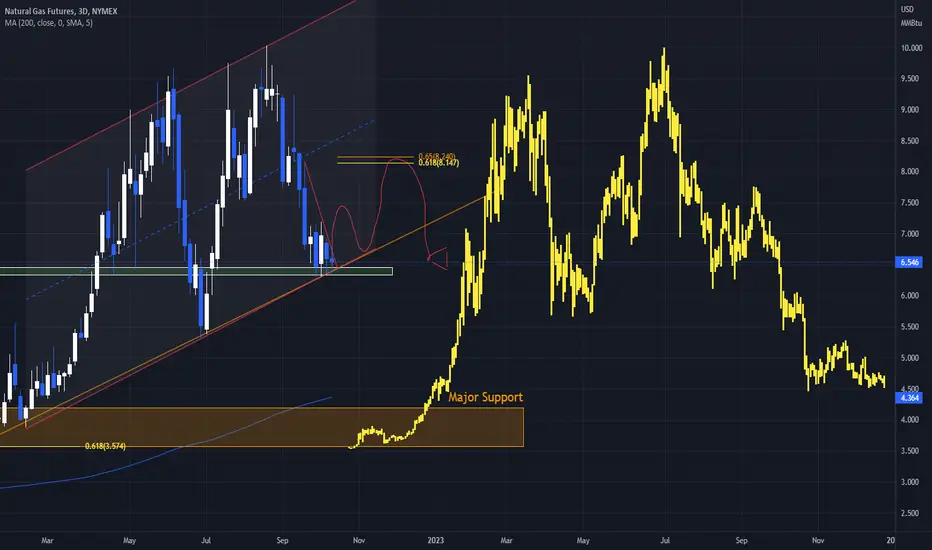
I am not saying this will happen, in fact I am personally bullish at the moment based on a number of factors. (For more on why I am bullish check out my channel for my nat gas trade)
I thought it was worth mentioning that BTC price action over the past few years is lining up very similarly to the price action of nat gas over the past year. Based on this vague information I am still bullish, but as I explain in my other post I will be bearish as we approach a particular zone. That is when I will pull this chart back up and compare the direction between the two prices.
Just something interesting to watch over the next few months!
Uwaga
Still an interesting chartWyłączenie odpowiedzialności
Informacje i publikacje nie stanowią i nie powinny być traktowane jako porady finansowe, inwestycyjne, tradingowe ani jakiekolwiek inne rekomendacje dostarczane lub zatwierdzone przez TradingView. Więcej informacji znajduje się w Warunkach użytkowania.
Wyłączenie odpowiedzialności
Informacje i publikacje nie stanowią i nie powinny być traktowane jako porady finansowe, inwestycyjne, tradingowe ani jakiekolwiek inne rekomendacje dostarczane lub zatwierdzone przez TradingView. Więcej informacji znajduje się w Warunkach użytkowania.