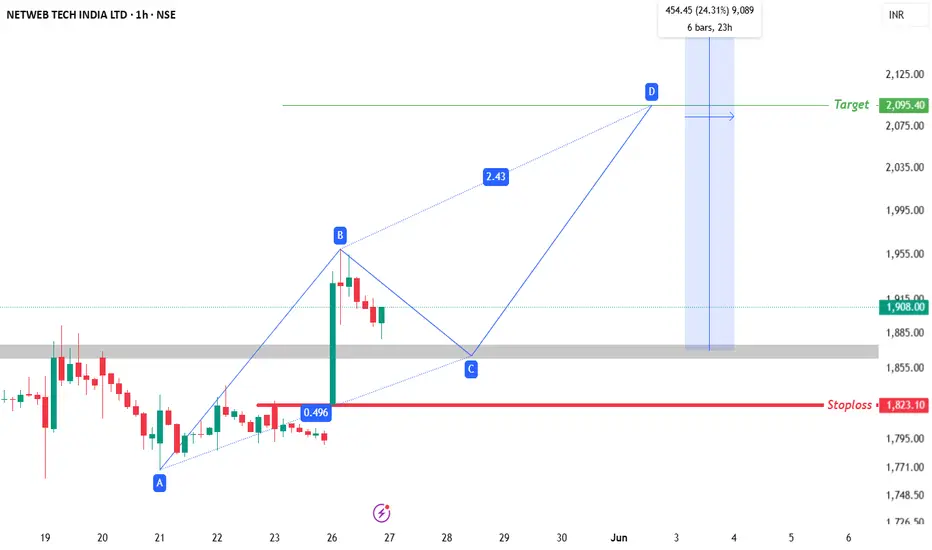
📈 Netweb Tech India LTD Trade Setup (1H Chart)
🔹 Pattern: Bullish Harmonic Formation
🔹 Entry Zone: ₹1865 – ₹1880
🔹 Stoploss: ₹1823.10 (Candle Close Basis)
🔹 Target 1: ₹2095.40 🎯
🔹 Target 2: ₹2310+ 🎯 (Only if ₹2095 breakout happens — approx. 24% upside)
💡 Key Insights:
✅ Bullish Harmonic Setup with ideal Risk:Reward
✅ Entry Zone aligns with key demand area (grey zone)
✅ Target 1: ₹2095.40 is the immediate resistance zone
✅ If ₹2095 is broken, stock has potential to rally up to ₹2310 (24% upside from entry)
✅ Price action near Point C zone is critical for confirmation
📌 Stoploss candle close only, Target Trigger Price
📌 This is not a buy/sell recommendation, just an educational trading idea.
📌 Market conditions can change; always conduct your own research.
📌 Understand risks before investing and take full responsibility for decisions.
Wyłączenie odpowiedzialności
Informacje i publikacje nie stanowią i nie powinny być traktowane jako porady finansowe, inwestycyjne, tradingowe ani jakiekolwiek inne rekomendacje dostarczane lub zatwierdzone przez TradingView. Więcej informacji znajduje się w Warunkach użytkowania.
Wyłączenie odpowiedzialności
Informacje i publikacje nie stanowią i nie powinny być traktowane jako porady finansowe, inwestycyjne, tradingowe ani jakiekolwiek inne rekomendacje dostarczane lub zatwierdzone przez TradingView. Więcej informacji znajduje się w Warunkach użytkowania.