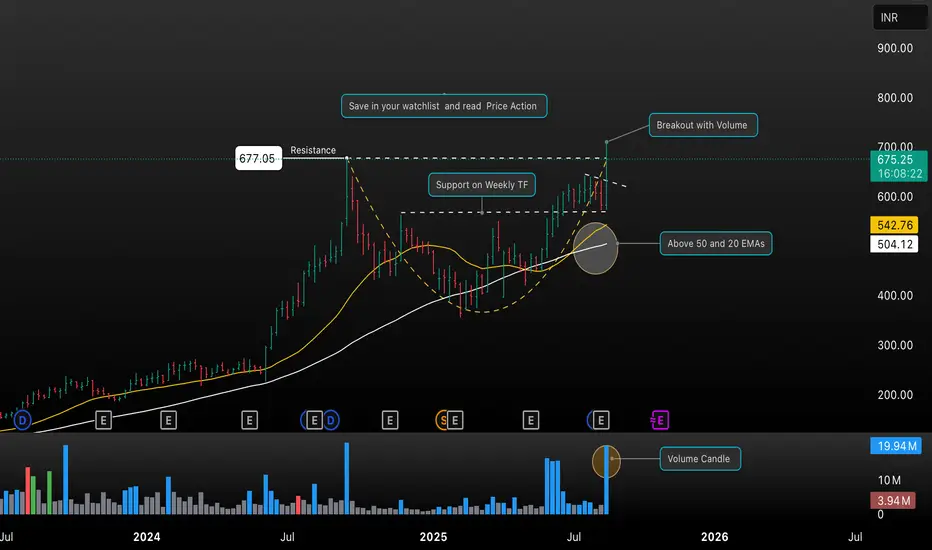
NAVA has showcased a significant bullish breakout on the weekly timeframe, closing above the long-standing resistance at ₹677.05 with a substantial spike in volume. The stock is presently trading above its 20 and 50 EMAs, reaffirming bullish momentum. Key highlights from this setup include:
• Strong resistance breakout with volume confirmation
• Sustained support observed on the weekly timeframe
• Price comfortably holding above crucial 20 EMA (₹542.76) and 50 EMA (₹504.12) levels
• Notable volume candle supporting the move
Add NAVA to your watchlist and closely read upcoming price action for potential continuation or pullback setups. Monitor for further volume and trend confirmation before taking new positions.
This setup is shared for educational purposes; always do your own research before trading or investing.
Wyłączenie odpowiedzialności
Informacje i publikacje przygotowane przez TradingView lub jego użytkowników, prezentowane na tej stronie, nie stanowią rekomendacji ani porad handlowych, inwestycyjnych i finansowych i nie powinny być w ten sposób traktowane ani wykorzystywane. Więcej informacji na ten temat znajdziesz w naszym Regulaminie.