Natural Gas Futures (INR) Weekly Chart pattern analysis.
For the students, We will include chart structure, patterns, demand-supply zones, and precise support/resistance levels based on what is seen on the charts :
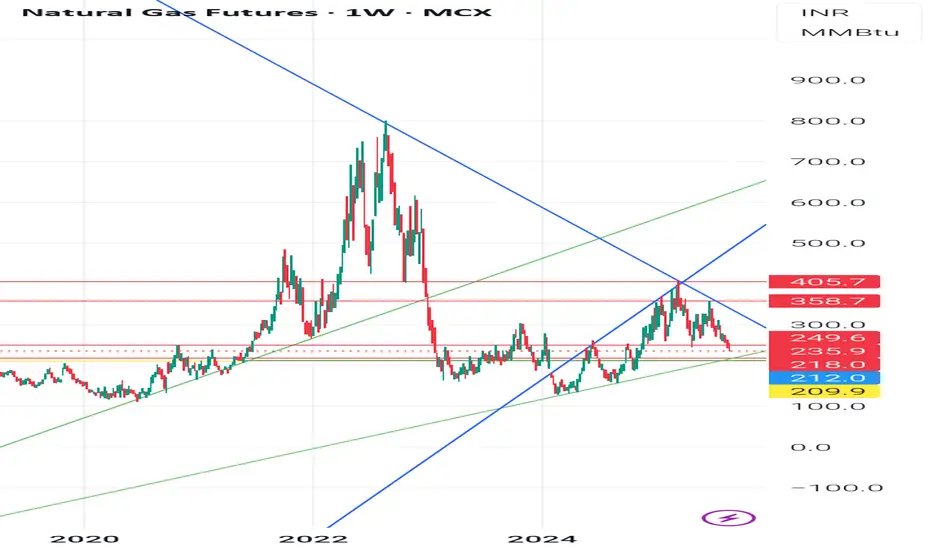
- Chart OverviewTimeframe: Weekly (1W)Current Price: 244.7 (down -5.30%)Price is near an important ascending trendline support (green line) after a strong correction from recent highs. Structure shows earlier breakout above descending trendline (blue) followed by a retest and rejection.
🧭 1. Trend Analysis- Long-Term Trend:From 2022 highs (900+), Natural Gas was in a sharp downtrend (blue descending trendline).Downtrend broke in late 2023, initiating a mid-term uptrend within an ascending channel.
Short-Term Trend:Since the 405.7 high (early 2025), prices are in a correction phase.Price now testing demand zone near 244-212.
📈 2. Chart Patterns,Ascending Channel: Price has been moving between parallel green lines since late 2023.Breakdown Risk: Price is testing the lower channel line; breakdown could trigger more downside.Head & Shoulders Possibility: The highs around 405-358 resemble a left shoulder-head-right shoulder formation, with neckline near 249-244. A confirmed break below could accelerate selling.
Supply Zone Rejection: Strong selling emerged from 358-405, marking it as a supply zone.
3. Key Technical Levels: Rejection Level: High Significance 405.7
-Major Supply 2025 high, strong rejection point 358.7
Secondary Supplying- Recent swing high before sell-off
249.6-244.7
- Current Zone - Channel support & neckline zone
218.0 - Demand Zone Past consolidation & buying interest
212.0 - Strong Support Historical demand zone floor
209.9
- Critical Support
If broken, opens path to 180-160⚖ 4. Demand & Supply ZonesDemand Zones:218-212 (weekly accumulation area)180-160 (last major base before rally)
Supply Zones:358-405 (heavy selling area)280-300 (minor supply if bounce occurs)
5. Possible ScenariosScenario
1 Support Holds:If 244-212 holds, expect a bounce towards 280 and 300.A close above 300 could re-test 358.
Scenario
2 - Breakdown:A close below 212 could lead to a quick drop towards 180-160.
👉 Disclaimer:
This is for educational purposes only, not trading advice. Futures & commodities are highly volatile; manage risk and consult a registered financial advisor.
#naturalgas #technicallevels #chartpatternabalysis #commoditytrading
For the students, We will include chart structure, patterns, demand-supply zones, and precise support/resistance levels based on what is seen on the charts :
- Chart OverviewTimeframe: Weekly (1W)Current Price: 244.7 (down -5.30%)Price is near an important ascending trendline support (green line) after a strong correction from recent highs. Structure shows earlier breakout above descending trendline (blue) followed by a retest and rejection.
🧭 1. Trend Analysis- Long-Term Trend:From 2022 highs (900+), Natural Gas was in a sharp downtrend (blue descending trendline).Downtrend broke in late 2023, initiating a mid-term uptrend within an ascending channel.
Short-Term Trend:Since the 405.7 high (early 2025), prices are in a correction phase.Price now testing demand zone near 244-212.
📈 2. Chart Patterns,Ascending Channel: Price has been moving between parallel green lines since late 2023.Breakdown Risk: Price is testing the lower channel line; breakdown could trigger more downside.Head & Shoulders Possibility: The highs around 405-358 resemble a left shoulder-head-right shoulder formation, with neckline near 249-244. A confirmed break below could accelerate selling.
Supply Zone Rejection: Strong selling emerged from 358-405, marking it as a supply zone.
3. Key Technical Levels: Rejection Level: High Significance 405.7
-Major Supply 2025 high, strong rejection point 358.7
Secondary Supplying- Recent swing high before sell-off
249.6-244.7
- Current Zone - Channel support & neckline zone
218.0 - Demand Zone Past consolidation & buying interest
212.0 - Strong Support Historical demand zone floor
209.9
- Critical Support
If broken, opens path to 180-160⚖ 4. Demand & Supply ZonesDemand Zones:218-212 (weekly accumulation area)180-160 (last major base before rally)
Supply Zones:358-405 (heavy selling area)280-300 (minor supply if bounce occurs)
5. Possible ScenariosScenario
1 Support Holds:If 244-212 holds, expect a bounce towards 280 and 300.A close above 300 could re-test 358.
Scenario
2 - Breakdown:A close below 212 could lead to a quick drop towards 180-160.
👉 Disclaimer:
This is for educational purposes only, not trading advice. Futures & commodities are highly volatile; manage risk and consult a registered financial advisor.
#naturalgas #technicallevels #chartpatternabalysis #commoditytrading
Powiązane publikacje
Wyłączenie odpowiedzialności
Informacje i publikacje nie stanowią i nie powinny być traktowane jako porady finansowe, inwestycyjne, tradingowe ani jakiekolwiek inne rekomendacje dostarczane lub zatwierdzone przez TradingView. Więcej informacji znajduje się w Warunkach użytkowania.