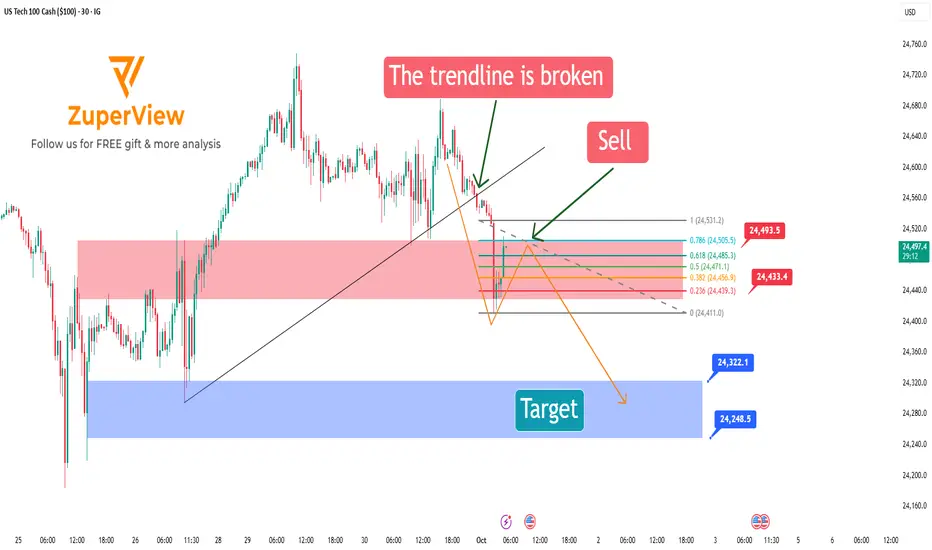
The chart signals a potential short opportunity after breaking the previous bullish structure and printing a strong bearish flash candle. The strategy focuses on shorting the pullback using fibonacci retracement measured from that candle.
🔺 1. Structure break and flash candle confirmation
- The price broke below the rising trendline supporting the bullish move from sep 26 to sep 30.
- Immediately after, a large bearish flash candle appeared — signaling strong selling pressure and a potential trend reversal.
- This candle becomes the reference point for measuring the retracement and anticipating a continuation to the downside.
📏 2. Measuring fibonacci from the flash candle (high → low)
- Apply fibonacci from the high to the low of the flash candle.
- This technique identifies potential resistance zones within the context of that specific bearish move.
Key fibonacci levels to watch:
0.5: 24,472.0 | 0.618: 24,486.4 | 0.786: 24,506.9
🎯 3. Ideal entry zone: from 0.382 to 0.786
- After a strong bearish flash candle, price often pulls back moderately before continuing lower.
- The optimal short zone is between fibo 0.382 and 0.786:
- This respects the integrity of the bearish impulse.
- A retracement smaller than 0.382 may be too shallow to confirm a strong rejection.
- A retracement beyond 0.786 might indicate loss of bearish momentum and invalidate the flash candle setup.
🎯 4. Bearish scenario and targets
If price reacts at the 0.382–0.786 zone and resumes downtrend, a potential ABC bearish correction forms:
A: Flash move down
B: Pullback to fib zone
C: Next impulsive leg down
Suggested take-profit levels:
🎯 Target 1: 24,322.1
🎯 Target 2: 24,248.5
🛡️ Stop-loss: above the flash candle’s high (around 24,533)
✅ Summary
After a structure break and a decisive bearish flash candle, us tech 100 is showing a clear bearish setup.
Using fibonacci measured from the high to low of the flash candle helps identify high-probability pullback zones.
📌 Entry zone: between 0.382 and 0.786 retracement — outside this range, the flash candle's power may be invalidated.
This is a momentum-following trade with defined entry, stop loss, and take profit zones.
Wait for confirmation from price action within the fib levels before entering.
Please like and comment below to support our traders. Your reactions will motivate us to do more analysis in the future 🙏✨
Harry Andrew @ ZuperView
Wyłączenie odpowiedzialności
Informacje i publikacje nie stanowią i nie powinny być traktowane jako porady finansowe, inwestycyjne, tradingowe ani jakiekolwiek inne rekomendacje dostarczane lub zatwierdzone przez TradingView. Więcej informacji znajduje się w Warunkach użytkowania.
Wyłączenie odpowiedzialności
Informacje i publikacje nie stanowią i nie powinny być traktowane jako porady finansowe, inwestycyjne, tradingowe ani jakiekolwiek inne rekomendacje dostarczane lub zatwierdzone przez TradingView. Więcej informacji znajduje się w Warunkach użytkowania.