Most traders chase trends too late or exit too early.
Quant systems don’t predict — they measure and adapt.
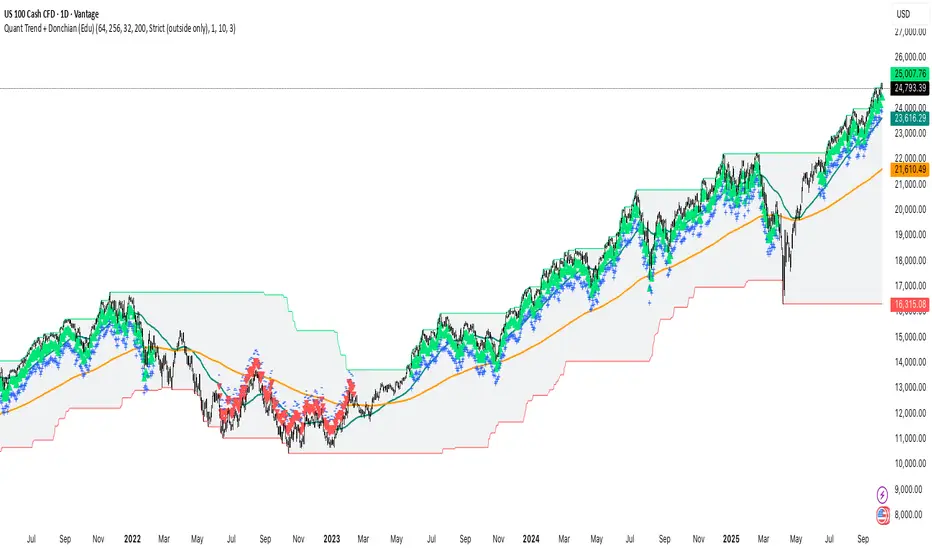
This educational chart uses the public Quant Trend + Donchian indicator to visualize how trend-following and breakout logic can define market regimes in NASDAQ 100 & S&P 500.
⚙️ Core Logic
• Trend — EMA(64 vs 256): approximates EWMAC trend state.
• Breakout — Donchian (200): identifies volatility-based range breaks.
• Volatility awareness — internally normalized to adjust behavior across markets.
📊 How to read it
• EMA fast > EMA slow and price near Donchian high → bullish trend regime.
• EMA fast < EMA slow and price near Donchian low → bearish regime.
• Inside channel with EMAs tangled → range or noise.
💡 Key insight
Regime definition + volatility scaling > entry cleverness.
Systems survive not by prediction, but by risk-controlled persistence.
This public view illustrates the foundations used in my more advanced risk-scaled quant strategies for NASDAQ and S&P indices.
#Quant #TrendFollowing #Breakout #Donchian #EMA #NASDAQ #SP500 #SystematicTrading #AlgorithmicTrading #Volatility
Quant systems don’t predict — they measure and adapt.
This educational chart uses the public Quant Trend + Donchian indicator to visualize how trend-following and breakout logic can define market regimes in NASDAQ 100 & S&P 500.
⚙️ Core Logic
• Trend — EMA(64 vs 256): approximates EWMAC trend state.
• Breakout — Donchian (200): identifies volatility-based range breaks.
• Volatility awareness — internally normalized to adjust behavior across markets.
📊 How to read it
• EMA fast > EMA slow and price near Donchian high → bullish trend regime.
• EMA fast < EMA slow and price near Donchian low → bearish regime.
• Inside channel with EMAs tangled → range or noise.
💡 Key insight
Regime definition + volatility scaling > entry cleverness.
Systems survive not by prediction, but by risk-controlled persistence.
This public view illustrates the foundations used in my more advanced risk-scaled quant strategies for NASDAQ and S&P indices.
#Quant #TrendFollowing #Breakout #Donchian #EMA #NASDAQ #SP500 #SystematicTrading #AlgorithmicTrading #Volatility
📊 Access & Subscription → algorific.gumroad.com/
💬 After purchase, DM @Algorific on TradingView for invite-only access.
💬 After purchase, DM @Algorific on TradingView for invite-only access.
Powiązane publikacje
Wyłączenie odpowiedzialności
Informacje i publikacje nie stanowią i nie powinny być traktowane jako porady finansowe, inwestycyjne, tradingowe ani jakiekolwiek inne rekomendacje dostarczane lub zatwierdzone przez TradingView. Więcej informacji znajduje się w Warunkach użytkowania.