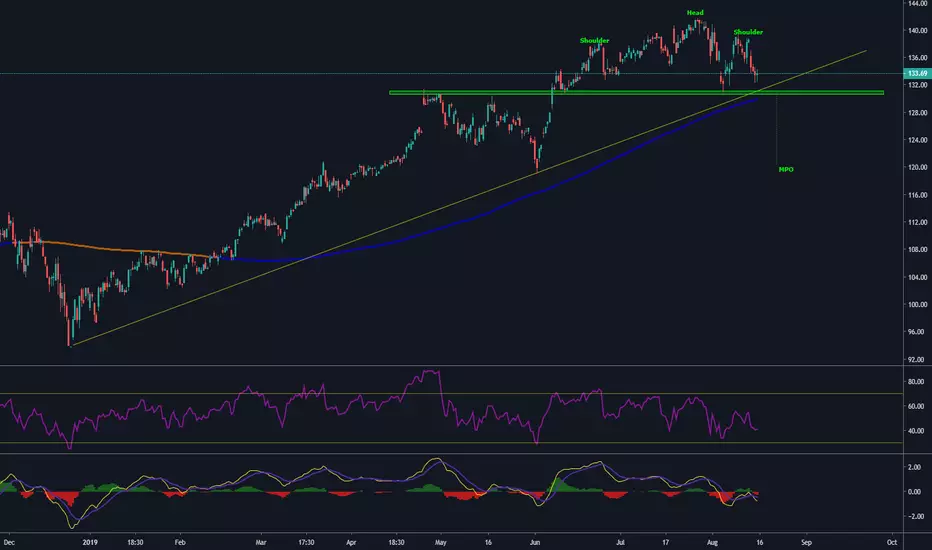
Chart analysis shows H&S pattern forming with divergence on both MACD and RSI. MPO target $120 support area and 200SMA on a daily chart (see in comments). First needs a good break through the trend line and 200SMA, quite strong support area around $130 level. If the market sell off continues next week, it could be the trigger for the pattern.
On the fundamental side major banks and investment funds see the stock as 'neutral-buy' and split price targets ranging from $115 to $160. Good Luck!
On the fundamental side major banks and investment funds see the stock as 'neutral-buy' and split price targets ranging from $115 to $160. Good Luck!
Uwaga
Wyłączenie odpowiedzialności
Informacje i publikacje przygotowane przez TradingView lub jego użytkowników, prezentowane na tej stronie, nie stanowią rekomendacji ani porad handlowych, inwestycyjnych i finansowych i nie powinny być w ten sposób traktowane ani wykorzystywane. Więcej informacji na ten temat znajdziesz w naszym Regulaminie.