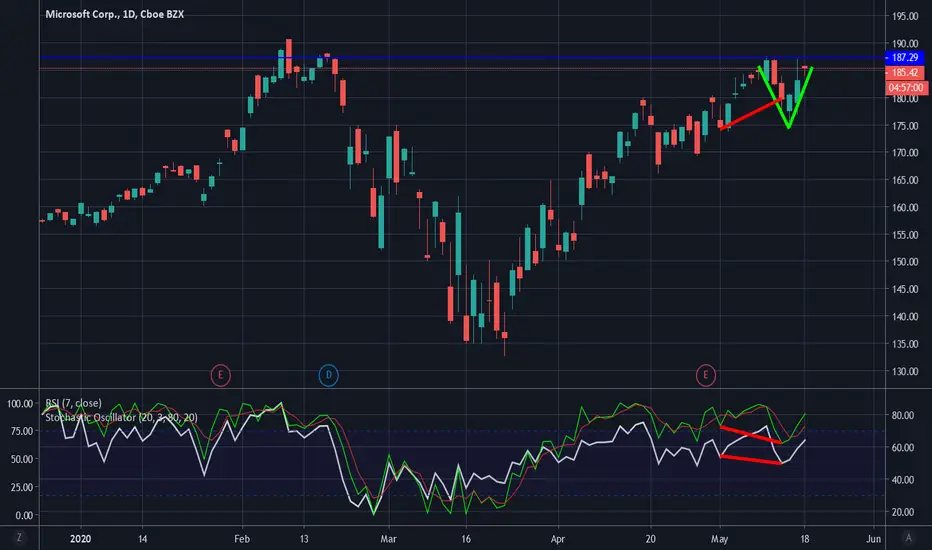
Last week I posted a weekly chart (linked below) to note that this is a stock to watch because of the doji candle. Though price opened higher, I am skeptical of more upside for a few reasons:
1- large "V" complete, see blue resistance line, though stock could go up to 188-190
2- stochastic (20day) and RSI (7-day) diverge from higher low price action (see 3 red lines) - on my chart I use 7 and 14 day RSI because I find in strong trends the 7day is more useful
3- I see two bearish signs in green "V" - there is a bearish engulfing candle on May 12 and on May 15 selling occurred in the same area (wick on green candle)
I bought puts for a swing trade and will be looking at lower timeframes. I want to see if today closes above or below weekly "V" close of 185.35
Powiązane publikacje
Wyłączenie odpowiedzialności
Informacje i publikacje przygotowane przez TradingView lub jego użytkowników, prezentowane na tej stronie, nie stanowią rekomendacji ani porad handlowych, inwestycyjnych i finansowych i nie powinny być w ten sposób traktowane ani wykorzystywane. Więcej informacji na ten temat znajdziesz w naszym Regulaminie.