Central banks can and do sway markets. The Nikkei-225, propelled by central bank actions in the US & Japan soared to all time high before pulling back sharply on Friday.

However, momentum snapped when BoJ unveiled its plan to offload risk assets off its balance sheet. This has cast doubt on the rally’s durability.
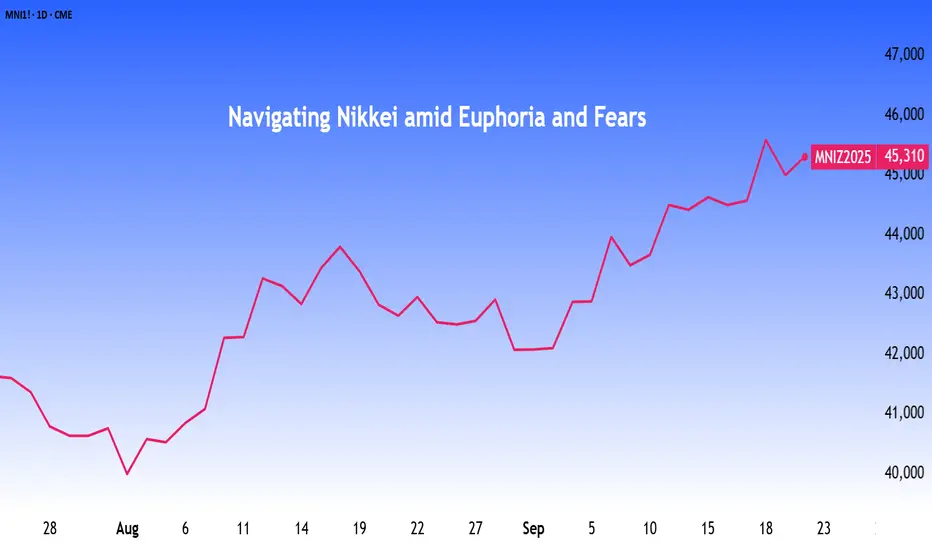
Nikkei Rockets Past 45,000 on Tech Surge and Fed Rate-Cut
Japan’s Nikkei-225 closed above the 45,000 mark on Thursday (18/Sep), powered by rally in tech stocks & wave of optimism after the US Fed’s 25-basis-point rate cut.
By last Friday (19/Sep), the index was scaling new record highs as investors looked ahead to the BoJ’s policy decision. Rates were anticipated to stay unchanged at around 0.5%. Market optimism was also lifted by data showing core inflation slowed to 2.7% in August, its lowest since November 2024 and the third straight month of easing.

Nikkei Edging Lower when BoJ Begins Gradual Unwinding of Stimulus
The BoJ held rates steady at around 0.5%, with seven of nine policymakers in favor. It also unveiled plans to shed riskier assets from its balance sheet.
The central bank will begin offloading its ETF holdings at about 330 billion yen a year, while gradually trimming its J-REIT holdings by around 5 billion yen annually, pacing the sales to avoid jolting markets. The Nikkei 225 gave up early gains and closed in the red on this news.

Foreign Investors Start Pulling Out of Japanese Equities
Foreign investors are retreating from Japanese equities, taking profits following record rally. Softer trade data has raised doubts about Japan’s export-driven recovery. At the same time, worries over global growth and potential recession are weighing on sentiment, prompting overseas investors to lock in gains.

Source: (Japan Exchange Group)
Technical Indicators Hint at Potential Pullback
Prices hold above the short-term MA, but momentum is clearly fading. The MACD remains above the signal line, yet the shrinking green histogram signals weakening bullishness.
Meanwhile, the RSI retreating from 73.81 to 64.51 shows buying pressure is easing, suggesting the Nikkei-225 may be entering a consolidation or pullback phase.

Bollinger Bands suggest the same. The uptrend remains intact, and buyers are still pushing prices higher, but the rally appears overextended, making the market susceptible to a short-term pullback.

Prices traded between 0% and 38.2% Fibonacci retracement levels. In the near term, absent material news flow, Micro Nikkei-225 futures are expected to trade between JPY 44,424 (serving as support) & JPY 45,700 (serving as resistance).

Hypothetical Trade Setup

In the short term, the Nikkei-225 faces pressure from potential foreign selling as global growth concerns persist. Japan’s safe-haven appeal appears fragile, heightening the risk of a near-term pullback.
Set against this backdrop, managers can manage their portfolio risk using the CME yen-denominated Micro Nikkei Futures contract to protect from drawdowns and to hedge against weakening USD versus the Yen.
• Entry: 44,950
• Target: 43,250
• Stop Loss: 46,000
• Potential Gains: JPY 85,000 ((44,950-43,250) x 50 yen/contract)
• Potential Losses: JPY 52,500 ((44,950-46,000) x 50 yen/contract)
• Reward-to-Risk: 1.6x
MARKET DATA
CME Real-time Market Data helps identify trading set-ups and express market views better. If you have futures in your trading portfolio, you can check out on CME Group data plans available that suit your trading needs tradingview.com/cme.
DISCLAIMER
This case study is for educational purposes only and does not constitute investment recommendations or advice. Nor are they used to promote any specific products, or services.
Trading or investment ideas cited here are for illustration only, as an integral part of a case study to demonstrate the fundamental concepts in risk management or trading under the market scenarios being discussed. Please read the FULL DISCLAIMER the link to which is provided in our profile description.
However, momentum snapped when BoJ unveiled its plan to offload risk assets off its balance sheet. This has cast doubt on the rally’s durability.
Nikkei Rockets Past 45,000 on Tech Surge and Fed Rate-Cut
Japan’s Nikkei-225 closed above the 45,000 mark on Thursday (18/Sep), powered by rally in tech stocks & wave of optimism after the US Fed’s 25-basis-point rate cut.
By last Friday (19/Sep), the index was scaling new record highs as investors looked ahead to the BoJ’s policy decision. Rates were anticipated to stay unchanged at around 0.5%. Market optimism was also lifted by data showing core inflation slowed to 2.7% in August, its lowest since November 2024 and the third straight month of easing.
Nikkei Edging Lower when BoJ Begins Gradual Unwinding of Stimulus
The BoJ held rates steady at around 0.5%, with seven of nine policymakers in favor. It also unveiled plans to shed riskier assets from its balance sheet.
The central bank will begin offloading its ETF holdings at about 330 billion yen a year, while gradually trimming its J-REIT holdings by around 5 billion yen annually, pacing the sales to avoid jolting markets. The Nikkei 225 gave up early gains and closed in the red on this news.
Foreign Investors Start Pulling Out of Japanese Equities
Foreign investors are retreating from Japanese equities, taking profits following record rally. Softer trade data has raised doubts about Japan’s export-driven recovery. At the same time, worries over global growth and potential recession are weighing on sentiment, prompting overseas investors to lock in gains.
Source: (Japan Exchange Group)
Technical Indicators Hint at Potential Pullback
Prices hold above the short-term MA, but momentum is clearly fading. The MACD remains above the signal line, yet the shrinking green histogram signals weakening bullishness.
Meanwhile, the RSI retreating from 73.81 to 64.51 shows buying pressure is easing, suggesting the Nikkei-225 may be entering a consolidation or pullback phase.
Bollinger Bands suggest the same. The uptrend remains intact, and buyers are still pushing prices higher, but the rally appears overextended, making the market susceptible to a short-term pullback.
Prices traded between 0% and 38.2% Fibonacci retracement levels. In the near term, absent material news flow, Micro Nikkei-225 futures are expected to trade between JPY 44,424 (serving as support) & JPY 45,700 (serving as resistance).
Hypothetical Trade Setup
In the short term, the Nikkei-225 faces pressure from potential foreign selling as global growth concerns persist. Japan’s safe-haven appeal appears fragile, heightening the risk of a near-term pullback.
Set against this backdrop, managers can manage their portfolio risk using the CME yen-denominated Micro Nikkei Futures contract to protect from drawdowns and to hedge against weakening USD versus the Yen.
• Entry: 44,950
• Target: 43,250
• Stop Loss: 46,000
• Potential Gains: JPY 85,000 ((44,950-43,250) x 50 yen/contract)
• Potential Losses: JPY 52,500 ((44,950-46,000) x 50 yen/contract)
• Reward-to-Risk: 1.6x
MARKET DATA
CME Real-time Market Data helps identify trading set-ups and express market views better. If you have futures in your trading portfolio, you can check out on CME Group data plans available that suit your trading needs tradingview.com/cme.
DISCLAIMER
This case study is for educational purposes only and does not constitute investment recommendations or advice. Nor are they used to promote any specific products, or services.
Trading or investment ideas cited here are for illustration only, as an integral part of a case study to demonstrate the fundamental concepts in risk management or trading under the market scenarios being discussed. Please read the FULL DISCLAIMER the link to which is provided in our profile description.
Full Disclaimer - linktr.ee/mintfinance
Wyłączenie odpowiedzialności
Informacje i publikacje przygotowane przez TradingView lub jego użytkowników, prezentowane na tej stronie, nie stanowią rekomendacji ani porad handlowych, inwestycyjnych i finansowych i nie powinny być w ten sposób traktowane ani wykorzystywane. Więcej informacji na ten temat znajdziesz w naszym Regulaminie.