Based on the daily chart of Meta Platforms (META):
🔹 Short-Term Outlook (1–3 weeks)
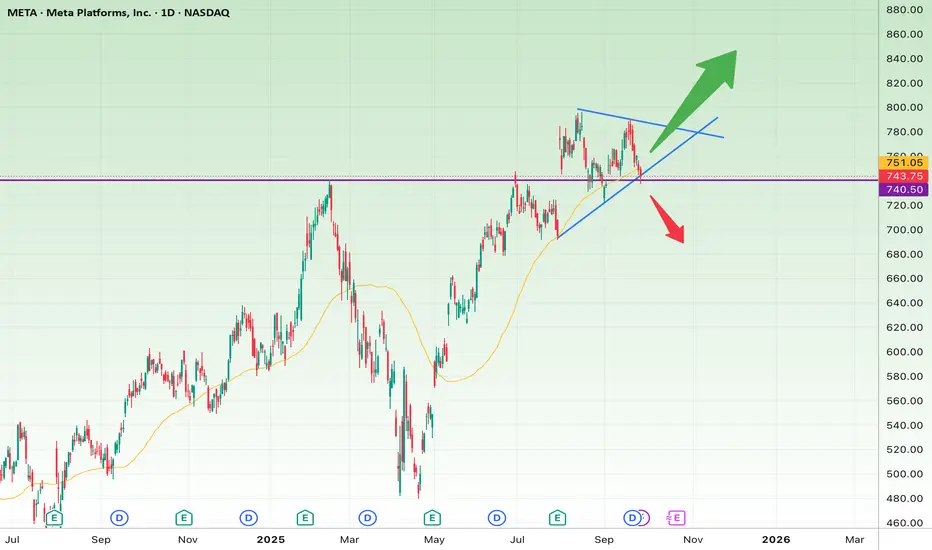
The price is consolidating within a symmetrical triangle pattern, usually a sign of an upcoming breakout.
Key support: $740–$745 (aligned with the rising trendline and 50-day moving average).
Key resistance: $770–$780 (downtrend line of the triangle).
📈 Bullish scenario (short-term):
A breakout above $780 with strong volume could trigger a move toward $805 (first target) and $830 (second target).
Stop-loss: A sustained close below $740.
📉 Bearish scenario (short-term):
A breakdown below $740 opens the door for a quick drop toward $710, and possibly $680.
Stop-loss: Recovery and close back above $760.
🔹 Long-Term Outlook (3–6 months)
The broader trend remains bullish, and the recent pullback looks more like a consolidation within the larger uptrend.
If the price breaks and holds above $805, the medium-term targets are $860 and then $920.
On the downside, losing $680 could trigger a deeper correction toward $620.
✅ Summary:
Short-term: The triangle is nearing completion; whichever side breaks first will define the next move.
Long-term: As long as $680 holds, the bigger picture remains bullish.
🔹 Short-Term Outlook (1–3 weeks)
The price is consolidating within a symmetrical triangle pattern, usually a sign of an upcoming breakout.
Key support: $740–$745 (aligned with the rising trendline and 50-day moving average).
Key resistance: $770–$780 (downtrend line of the triangle).
📈 Bullish scenario (short-term):
A breakout above $780 with strong volume could trigger a move toward $805 (first target) and $830 (second target).
Stop-loss: A sustained close below $740.
📉 Bearish scenario (short-term):
A breakdown below $740 opens the door for a quick drop toward $710, and possibly $680.
Stop-loss: Recovery and close back above $760.
🔹 Long-Term Outlook (3–6 months)
The broader trend remains bullish, and the recent pullback looks more like a consolidation within the larger uptrend.
If the price breaks and holds above $805, the medium-term targets are $860 and then $920.
On the downside, losing $680 could trigger a deeper correction toward $620.
✅ Summary:
Short-term: The triangle is nearing completion; whichever side breaks first will define the next move.
Long-term: As long as $680 holds, the bigger picture remains bullish.
Wyłączenie odpowiedzialności
Informacje i publikacje przygotowane przez TradingView lub jego użytkowników, prezentowane na tej stronie, nie stanowią rekomendacji ani porad handlowych, inwestycyjnych i finansowych i nie powinny być w ten sposób traktowane ani wykorzystywane. Więcej informacji na ten temat znajdziesz w naszym Regulaminie.