### **Technical Analysis of MADHYA BHARAT AGRO P. LTD (NSE)**
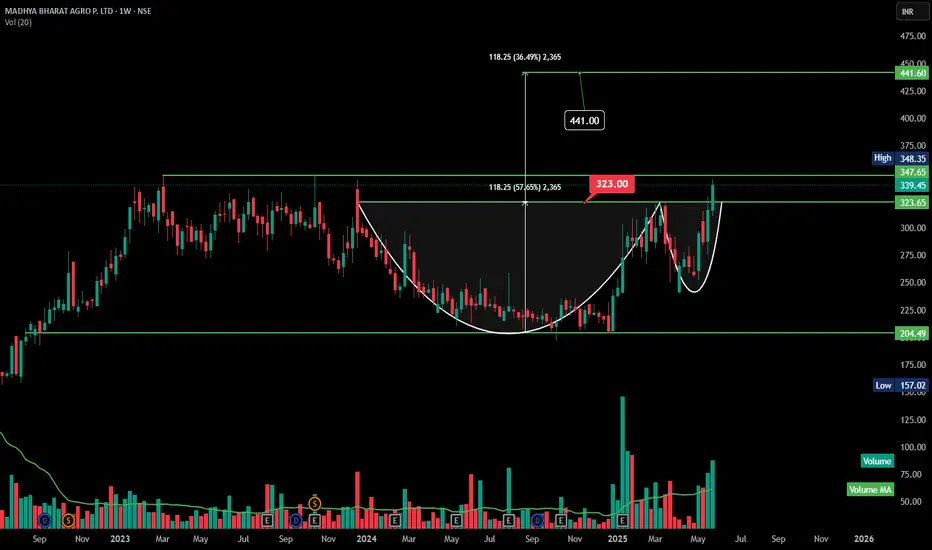
The chart reveals a **cup and handle** patternon wkly , which is a **bullish continuation** signal, suggesting strong upward momentum.
### **Key Observations:**
1. **Cup Formation:**
- The price formed a rounded bottom over an extended period, indicating **accumulation**.
- Depth of the cup: **118.25 points (36.49%)** from **204.49 INR to 323.65 INR**.
2. **Handle Formation:**
- A brief consolidation near **323.65 INR**, forming the handle.
3. **Breakout & Price Action:**
- The breakout above **323.00 INR** is confirmed with rising volume.
- The current price is **339.45 INR**, up **7.27% (23.00 INR)**.
- **Target price:** **441.60 INR**, based on the pattern’s depth.
### **Indicators to Watch:**
- **Volume:** Strong surge in trading volume supports the breakout.
- **RSI:** Above **60**, it confirms bullish momentum.
- **Support Level:** **323 INR** now serves as a key support.
Wyłączenie odpowiedzialności
Informacje i publikacje nie stanowią i nie powinny być traktowane jako porady finansowe, inwestycyjne, tradingowe ani jakiekolwiek inne rekomendacje dostarczane lub zatwierdzone przez TradingView. Więcej informacji znajduje się w Warunkach użytkowania.
Wyłączenie odpowiedzialności
Informacje i publikacje nie stanowią i nie powinny być traktowane jako porady finansowe, inwestycyjne, tradingowe ani jakiekolwiek inne rekomendacje dostarczane lub zatwierdzone przez TradingView. Więcej informacji znajduje się w Warunkach użytkowania.