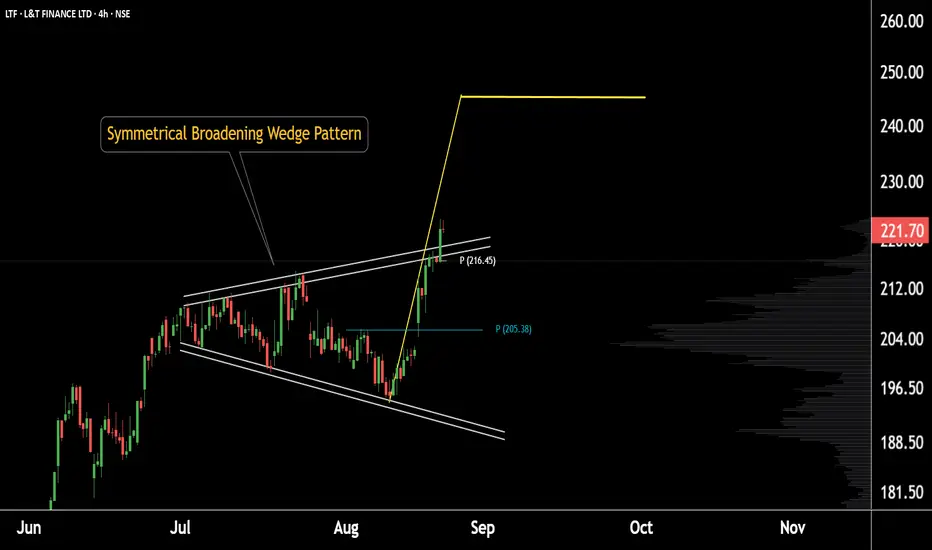
This is the daily chart of L&T Finance.
The stock has been forming a broadening wedge pattern and has recently given a pattern breakout around 220.
Currently, L&T Finance is sustaining above its daily pivot level of 216, with strong support in the 215–220 zone.
If this support holds, we may witness higher prices in the stock.
Thank you.
The stock has been forming a broadening wedge pattern and has recently given a pattern breakout around 220.
Currently, L&T Finance is sustaining above its daily pivot level of 216, with strong support in the 215–220 zone.
If this support holds, we may witness higher prices in the stock.
Thank you.
@RahulSaraoge
Connect us at t.me/stridesadvisory
Connect us at t.me/stridesadvisory
Wyłączenie odpowiedzialności
Informacje i publikacje przygotowane przez TradingView lub jego użytkowników, prezentowane na tej stronie, nie stanowią rekomendacji ani porad handlowych, inwestycyjnych i finansowych i nie powinny być w ten sposób traktowane ani wykorzystywane. Więcej informacji na ten temat znajdziesz w naszym Regulaminie.