About Pattern:
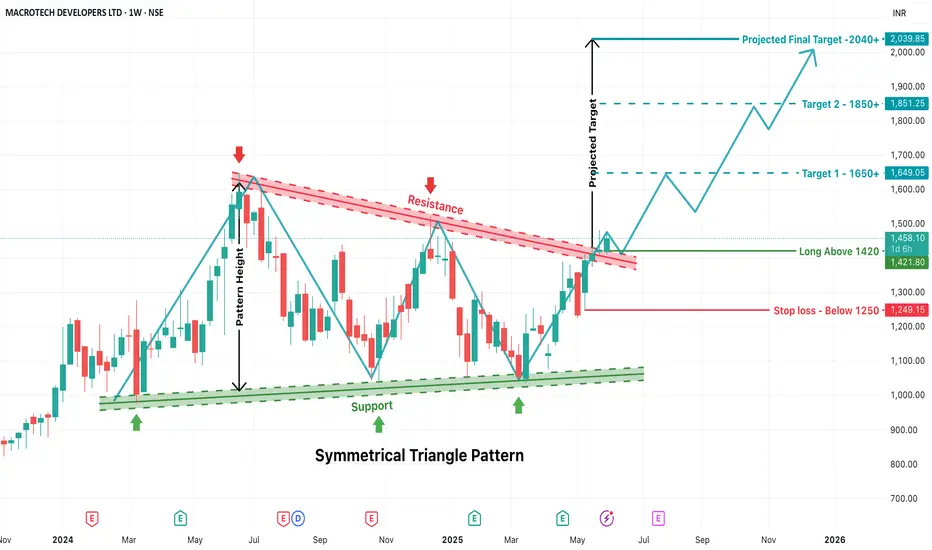
A Symmetrical Triangle Pattern is a continuation chart pattern formed when price action creates lower highs and higher lows, converging toward a point. It reflects indecision and compression in price before a breakout occurs. The breakout can be on either side, but here, a bullish breakout has occurred.
Support Line: Formed by connecting the swing lows (green arrows), which are gradually increasing.
Resistance Line: Formed by connecting the swing highs (red arrows), which are gradually decreasing.
This convergence of support and resistance forms the triangle.
Breakout Confirmation
Breakout Level: ₹1420
The stock has clearly broken out above the resistance trendline, indicating a strong bullish signal on the weekly timeframe.
Entry and Stop Loss Strategy
Entry Point:Enter the trade only above ₹1420 after confirmation of breakout. This acts as a psychological and technical barrier.
Stop Loss (SL):Set below ₹1250, which is well below the previous swing lows and triangle support. This acts as a safety net in case of a false breakout or reversal.
Target Calculation – Based on Pattern Height
Pattern Height:
Calculated from the highest swing high inside the triangle to the lowest swing low.
This vertical distance is then added to the breakout point (₹1420) to estimate the price targets.
Target 1: ₹1650+
This is the first resistance zone post-breakout and a psychologically important round number.
Target 2: ₹1850+
Based on the full extension of the pattern height and intermediate resistance zone.
Final Projected Target: ₹2040+
This is the complete projection of the triangle pattern height.
This setup is suitable for:
Once price sustains above ₹1420, the stock is expected to follow a bullish trajectory toward ₹1650–2040+ over the coming weeks/months.
A Symmetrical Triangle Pattern is a continuation chart pattern formed when price action creates lower highs and higher lows, converging toward a point. It reflects indecision and compression in price before a breakout occurs. The breakout can be on either side, but here, a bullish breakout has occurred.
Support Line: Formed by connecting the swing lows (green arrows), which are gradually increasing.
Resistance Line: Formed by connecting the swing highs (red arrows), which are gradually decreasing.
This convergence of support and resistance forms the triangle.
Breakout Confirmation
Breakout Level: ₹1420
The stock has clearly broken out above the resistance trendline, indicating a strong bullish signal on the weekly timeframe.
Entry and Stop Loss Strategy
Entry Point:Enter the trade only above ₹1420 after confirmation of breakout. This acts as a psychological and technical barrier.
Stop Loss (SL):Set below ₹1250, which is well below the previous swing lows and triangle support. This acts as a safety net in case of a false breakout or reversal.
Target Calculation – Based on Pattern Height
Pattern Height:
Calculated from the highest swing high inside the triangle to the lowest swing low.
This vertical distance is then added to the breakout point (₹1420) to estimate the price targets.
Target 1: ₹1650+
This is the first resistance zone post-breakout and a psychologically important round number.
Target 2: ₹1850+
Based on the full extension of the pattern height and intermediate resistance zone.
Final Projected Target: ₹2040+
This is the complete projection of the triangle pattern height.
This setup is suitable for:
- Swing traders looking for positional opportunities
- Investors seeking breakout confirmation for fresh entries
- Trend followers waiting for consolidation breakouts
Once price sustains above ₹1420, the stock is expected to follow a bullish trajectory toward ₹1650–2040+ over the coming weeks/months.
📈 Trade Smarter with TradZoo!
📣 Telegram: t.me/tradzooIndex
📣 Forex Telegram: t.me/tradzoofx
📲 Mobile App: tradzoo.com/download
📲 Forex App:tradzoo.com/forex/download
🔗 Website: bit.ly/tradzoopage
📣 Telegram: t.me/tradzooIndex
📣 Forex Telegram: t.me/tradzoofx
📲 Mobile App: tradzoo.com/download
📲 Forex App:tradzoo.com/forex/download
🔗 Website: bit.ly/tradzoopage
Wyłączenie odpowiedzialności
Informacje i publikacje przygotowane przez TradingView lub jego użytkowników, prezentowane na tej stronie, nie stanowią rekomendacji ani porad handlowych, inwestycyjnych i finansowych i nie powinny być w ten sposób traktowane ani wykorzystywane. Więcej informacji na ten temat znajdziesz w naszym Regulaminie.