📊 Chainlink (
 LINKUSDT) Retesting Mid-Range Resistance Within a Healthy Uptrend
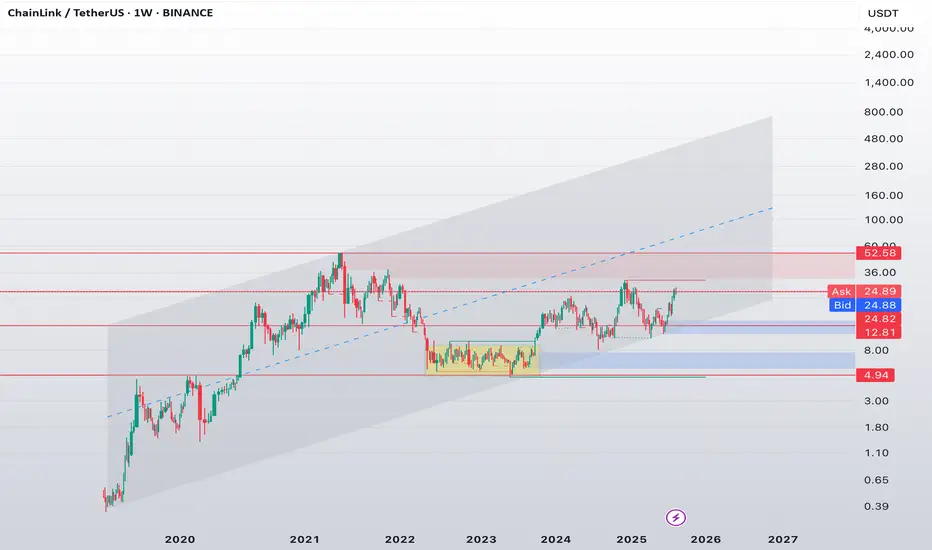
On the weekly chart,LINK continues to maintain a clear higher low structure, currently retesting the critical resistance area around $25 — a level that historically capped upside in prior cycles.
🔍 Structural Highlights:
🔲The accumulation zone ($5–9) lasted over 500 days and ended with a breakout in late 2023
🔵 $12.80 held as a key higher low, validating the breakout structure
📈 Price is now approaching the $24–26 resistance — a historically significant supply zone that acted as a pivot point during 2021–2022
🧭 Scenarios I’m watching:
✅ Bullish case:
A confirmed breakout above $26 with weekly close ➝ opens the door toward $34–38 (next major supply block)
On macro strength, eventual extension toward $52 remains technically viable
❌ Bearish case:
Rejection at $25 ➝ pullback toward $18.50–$20 range for another higher low and continuation setup
🔬 Trend Dynamics:
Price is tracking inside a long-term ascending channel from the 2020 cycle
Current structure sits around the midline of the channel, which often acts as equilibrium or resistance in trend development
📌 My take:
LINK has completed its accumulation → expansion transition and is entering a more directional phase.
As long as we remain above $20, the macro structure stays bullish. But I’m not rushing into resistance at $25 — waiting for confirmation.
#LINK #Chainlink #CryptoAnalysis #TradingView #Altcoins #TechnicalOutlook #MacroStructure #MarketCycle
On the weekly chart,
🔍 Structural Highlights:
🔲The accumulation zone ($5–9) lasted over 500 days and ended with a breakout in late 2023
🔵 $12.80 held as a key higher low, validating the breakout structure
📈 Price is now approaching the $24–26 resistance — a historically significant supply zone that acted as a pivot point during 2021–2022
🧭 Scenarios I’m watching:
✅ Bullish case:
A confirmed breakout above $26 with weekly close ➝ opens the door toward $34–38 (next major supply block)
On macro strength, eventual extension toward $52 remains technically viable
❌ Bearish case:
Rejection at $25 ➝ pullback toward $18.50–$20 range for another higher low and continuation setup
🔬 Trend Dynamics:
Price is tracking inside a long-term ascending channel from the 2020 cycle
Current structure sits around the midline of the channel, which often acts as equilibrium or resistance in trend development
📌 My take:
As long as we remain above $20, the macro structure stays bullish. But I’m not rushing into resistance at $25 — waiting for confirmation.
#LINK #Chainlink #CryptoAnalysis #TradingView #Altcoins #TechnicalOutlook #MacroStructure #MarketCycle
Telegram Channel⏩ t.me/+aTlXBWnLy2Y4OTQ6
🔥Trade cryptocurrency on the exchange Bybit - partner.bybit.com/b/94881
🔥Trade cryptocurrency on the exchange Bybit - partner.bybit.com/b/94881
Wyłączenie odpowiedzialności
Informacje i publikacje przygotowane przez TradingView lub jego użytkowników, prezentowane na tej stronie, nie stanowią rekomendacji ani porad handlowych, inwestycyjnych i finansowych i nie powinny być w ten sposób traktowane ani wykorzystywane. Więcej informacji na ten temat znajdziesz w naszym Regulaminie.