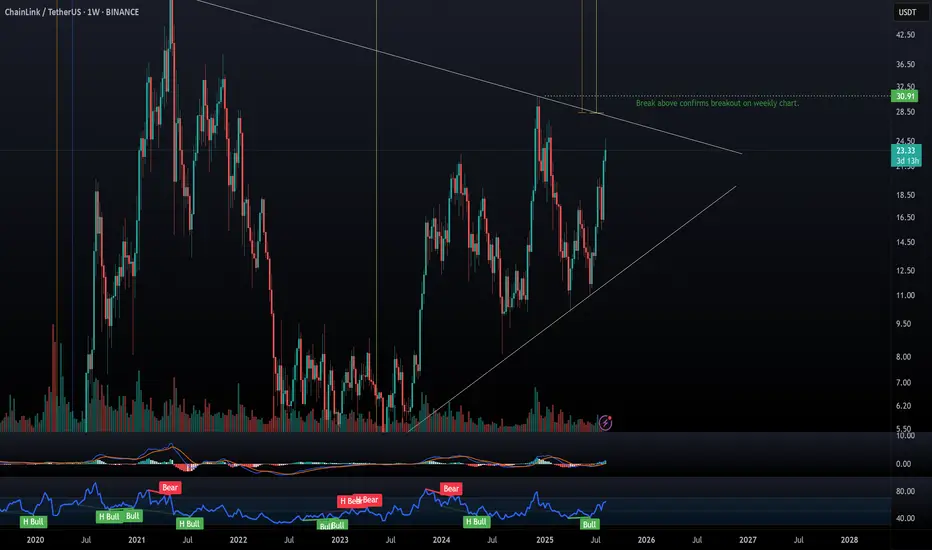
A huge bullflag pattern has formed on the weekly chart, if this breaks to the upside we could be looking a face melting targets, with the most bullish targets exceeding $1000.
I've added horizontal ray lines with highlighted price targets to the left, colour coded to the corresponding price range. Once the price breaks out of the triangle, I've also added a confirmed breakout level, which is the previous resistance line touch point.
Hopefully this plays out and we'll all buying yachts :)
I'm not a financial advisor and my posts are not financial advice and should not be taken as financial advice. They're only my interpretation based on my own research and should only be used for educational and entertainment purposes.
Born Of Crypto :)
Born Of Crypto :)
Wyłączenie odpowiedzialności
Informacje i publikacje nie stanowią i nie powinny być traktowane jako porady finansowe, inwestycyjne, tradingowe ani jakiekolwiek inne rekomendacje dostarczane lub zatwierdzone przez TradingView. Więcej informacji znajduje się w Warunkach użytkowania.