📊 1-Day Technical Summary
Current Price: ₹2,030.50
Open: ₹1,998.00
High: ₹2,084.40
Low: ₹1,954.70
Close: ₹2,030.50
Volume: 177,664 shares
VWAP: ₹2,029.19
Price Change: -0.67%
🔍 Technical Indicators
RSI (14-day): 39.91 — Indicates a bearish trend, approaching oversold conditions
MACD: -16.34 — Suggests a bearish momentum
Moving Averages: All short-term and long-term moving averages (MA5 to MA200) are signaling a Strong Sell
Stochastic RSI: In a bearish zone, reinforcing the downward momentum
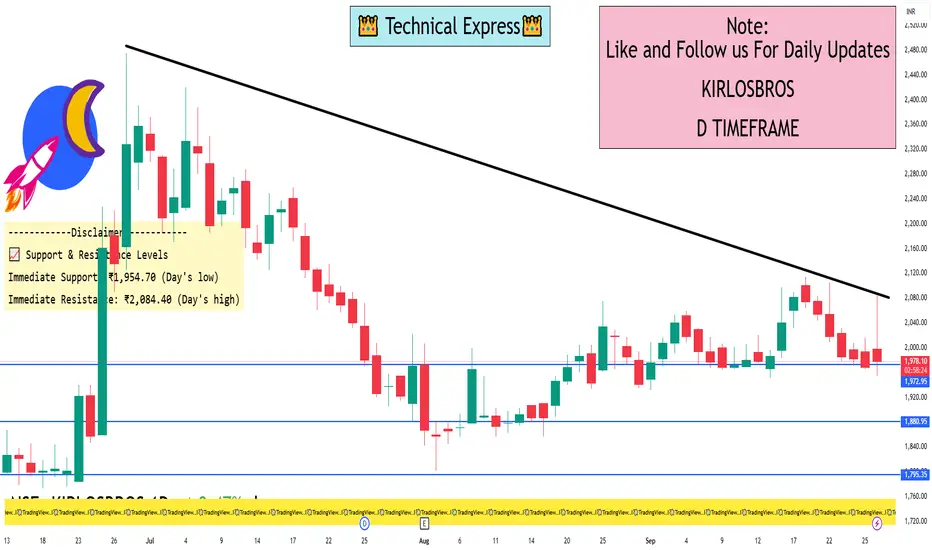
📈 Support & Resistance Levels
Immediate Support: ₹1,954.70 (Day's low)
Immediate Resistance: ₹2,084.40 (Day's high)
⚠️ Conclusion
The 1-day technical indicators for Kirloskar Brothers Ltd. suggest a bearish outlook, with the stock trading below key moving averages and exhibiting negative momentum. Traders should exercise caution and consider waiting for a confirmation of trend reversal before initiating long positions.
Current Price: ₹2,030.50
Open: ₹1,998.00
High: ₹2,084.40
Low: ₹1,954.70
Close: ₹2,030.50
Volume: 177,664 shares
VWAP: ₹2,029.19
Price Change: -0.67%
🔍 Technical Indicators
RSI (14-day): 39.91 — Indicates a bearish trend, approaching oversold conditions
MACD: -16.34 — Suggests a bearish momentum
Moving Averages: All short-term and long-term moving averages (MA5 to MA200) are signaling a Strong Sell
Stochastic RSI: In a bearish zone, reinforcing the downward momentum
📈 Support & Resistance Levels
Immediate Support: ₹1,954.70 (Day's low)
Immediate Resistance: ₹2,084.40 (Day's high)
⚠️ Conclusion
The 1-day technical indicators for Kirloskar Brothers Ltd. suggest a bearish outlook, with the stock trading below key moving averages and exhibiting negative momentum. Traders should exercise caution and consider waiting for a confirmation of trend reversal before initiating long positions.
I built a Buy & Sell Signal Indicator with 85% accuracy.
📈 Get access via DM or
WhatsApp: wa.link/d997q0
Contact - +91 76782 40962
| Email: techncialexpress@gmail.com
| Script Coder | Trader | Investor | From India
📈 Get access via DM or
WhatsApp: wa.link/d997q0
Contact - +91 76782 40962
| Email: techncialexpress@gmail.com
| Script Coder | Trader | Investor | From India
Powiązane publikacje
Wyłączenie odpowiedzialności
Informacje i publikacje nie stanowią i nie powinny być traktowane jako porady finansowe, inwestycyjne, tradingowe ani jakiekolwiek inne rekomendacje dostarczane lub zatwierdzone przez TradingView. Więcej informacji znajduje się w Warunkach użytkowania.