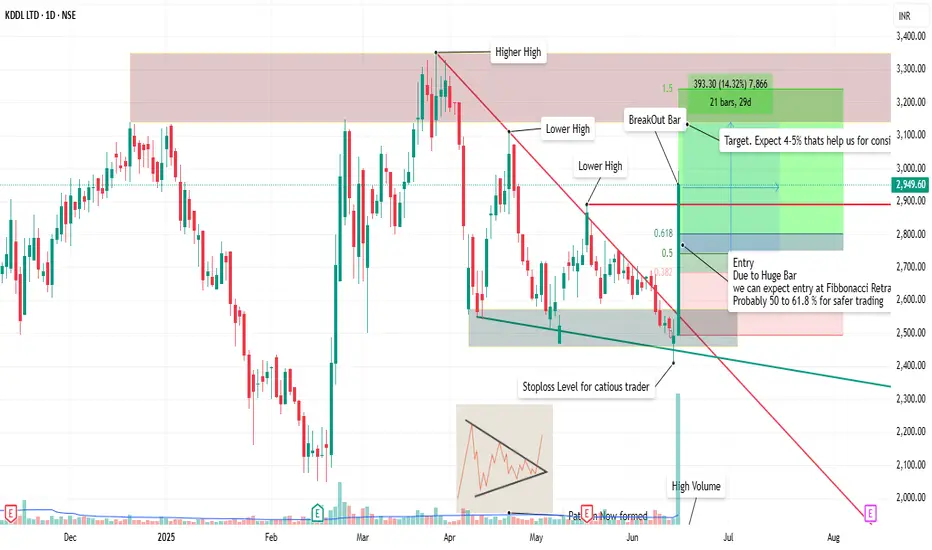
📊 1. Price Action Breakdown
✅ Breakout Confirmed:
Clear breakout from a descending triangle/consolidation pattern, backed by high volume.
Broke past multiple lower highs and trendline resistance.
📈 Structure:
Formed higher low support near ₹2,350–₹2,400 zone.
Breakout bar was wide-range and on extreme volume — a sign of institutional participation.
🔁 Entry Strategy:
Ideal entries lie in the Fibonacci retracement zone (38.2%–61.8%), roughly ₹2,650–₹2,750, if the price pulls back.
Safer for swing traders to wait for that zone.
🎯 Target Zone:
₹3,250–₹3,350 range (based on measured move and previous resistance).
This offers a 14%+ move, but as per our plan, aiming for 4–5% consistent profit is wise.
📦 2. Volume Analysis
High Volume Spike on breakout bar = strong confirmation.
Prior to breakout, volume was compressing — classic coiling pattern behavior before explosive move.
🧭 3. Stage Classification
✅ Current Stage: Stage 2 – Early Markup Phase
Reasons:
Breaking out from a long correction/consolidation.
High-volume confirmation.
Higher lows and breakout from downtrend.
Clear resistance zones above, making it a trending candidate.
🧯 4. Trade Plan Summary
Metric Value
📌 Entry Range ₹2,650–₹2,750 (Fibonacci zone)
🧯 Stop Loss ₹2,400–₹2,450
📈 Target 1 ₹3,100–₹3,200
📈 Target 2 (Positional) ₹3,300–₹3,350
💡 Reward:Risk 1:2+ potential if managed well
✅ Conclusion
KDDL Ltd is in a Stage 2 breakout phase, with a textbook setup:
Strong volume breakout
Pullback expected
Defined entry and SL zones
Uwaga
cautious typoPowiązane publikacje
Wyłączenie odpowiedzialności
Informacje i publikacje przygotowane przez TradingView lub jego użytkowników, prezentowane na tej stronie, nie stanowią rekomendacji ani porad handlowych, inwestycyjnych i finansowych i nie powinny być w ten sposób traktowane ani wykorzystywane. Więcej informacji na ten temat znajdziesz w naszym Regulaminie.
Powiązane publikacje
Wyłączenie odpowiedzialności
Informacje i publikacje przygotowane przez TradingView lub jego użytkowników, prezentowane na tej stronie, nie stanowią rekomendacji ani porad handlowych, inwestycyjnych i finansowych i nie powinny być w ten sposób traktowane ani wykorzystywane. Więcej informacji na ten temat znajdziesz w naszym Regulaminie.