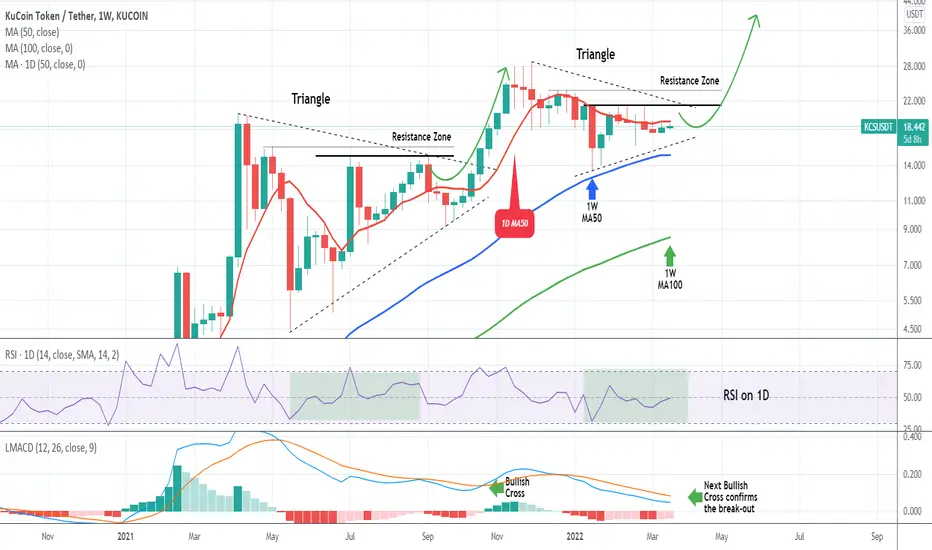
I decided to make an analysis of the KuCoin token on the 1W time-frame in order to give you a better understanding of how similar the market structure since the November High is with that of April - September 2021.
As you see, both patterns are Triangles and the 1W chart helps at realizing the levels we need to pay attention in order to spot the next rally before it begins. Right now the price is below the 1D MA50 (red trend-line) but above the 1W MA50 (blue trend-line) which has been supporting since January 2021. There is a specific Resistance zone to beat, which as per the 2021 Triangle, is made of the last two Lower Highs. A break above this level, will also be a break above the Triangle and the 1D RSI shows that we may have just one pull-back left to the bottom of the Triangle, before the new rally that will cause the break-out begins. The next time the LMACD makes a Bullish Cross, will be a (rather late) confirmation.
--------------------------------------------------------------------------------------------------------
** Please support this idea with your likes and comments, it is the best way to keep it relevant and support me. **
--------------------------------------------------------------------------------------------------------
👑Best Signals (Forex/Crypto+70% accuracy) & Account Management (+20% profit/month on 10k accounts)
💰Free Channel t.me/tradingshotglobal
🤵Contact info@tradingshot.com t.me/tradingshot
🔥New service: next X100 crypto GEMS!
💰Free Channel t.me/tradingshotglobal
🤵Contact info@tradingshot.com t.me/tradingshot
🔥New service: next X100 crypto GEMS!
Wyłączenie odpowiedzialności
Informacje i publikacje przygotowane przez TradingView lub jego użytkowników, prezentowane na tej stronie, nie stanowią rekomendacji ani porad handlowych, inwestycyjnych i finansowych i nie powinny być w ten sposób traktowane ani wykorzystywane. Więcej informacji na ten temat znajdziesz w naszym Regulaminie.