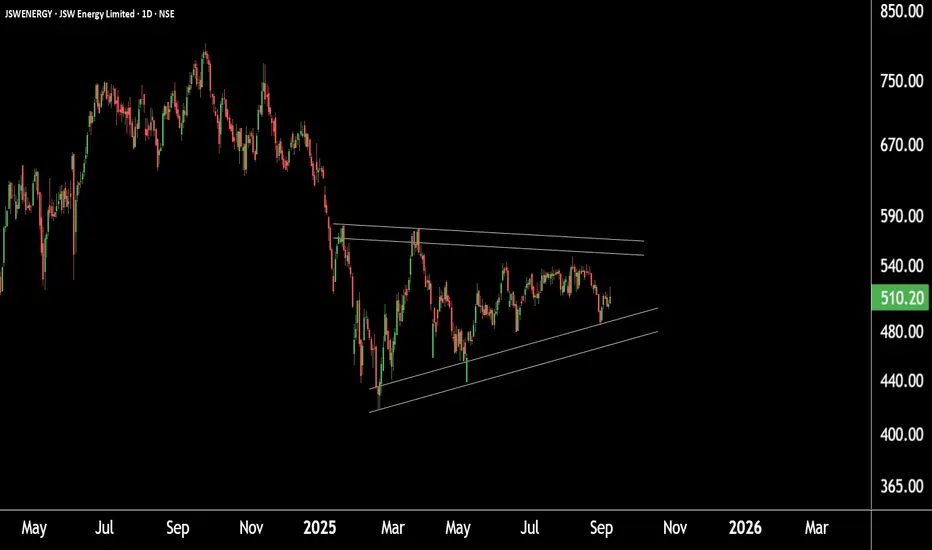
This is the daily timeframe chart of JSW Energy.
The stock is currently forming a symmetrical triangle pattern with support around ₹465–₹475 and resistance near ₹564–₹570.
If JSW Energy sustains above this resistance zone, it could trigger a breakout, potentially leading to higher price levels in the coming sessions.
Thank you.
The stock is currently forming a symmetrical triangle pattern with support around ₹465–₹475 and resistance near ₹564–₹570.
If JSW Energy sustains above this resistance zone, it could trigger a breakout, potentially leading to higher price levels in the coming sessions.
Thank you.
@RahulSaraoge
Connect us at t.me/stridesadvisory
Connect us at t.me/stridesadvisory
Wyłączenie odpowiedzialności
Informacje i publikacje przygotowane przez TradingView lub jego użytkowników, prezentowane na tej stronie, nie stanowią rekomendacji ani porad handlowych, inwestycyjnych i finansowych i nie powinny być w ten sposób traktowane ani wykorzystywane. Więcej informacji na ten temat znajdziesz w naszym Regulaminie.