Target for $JNUG at different $gold spot prices $GDX $NUGT $GLD
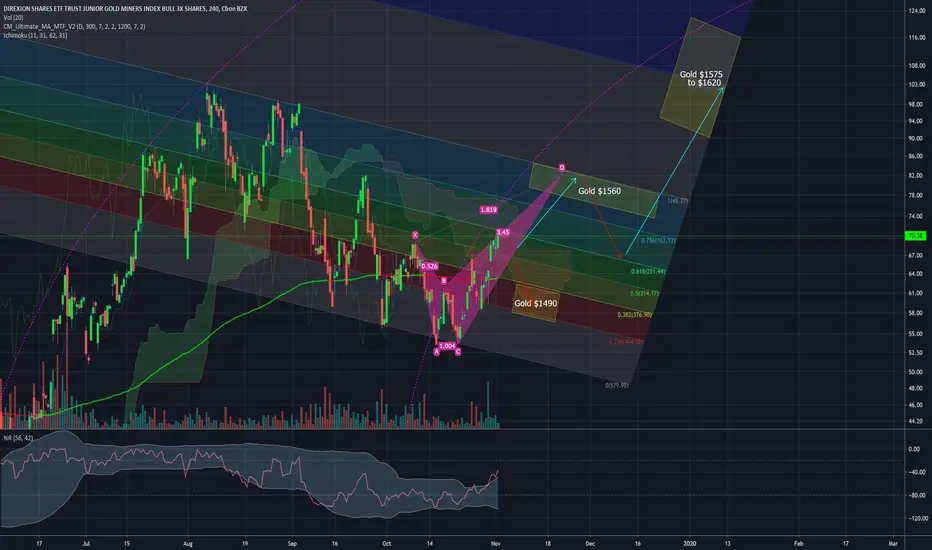
The ascending triangle in the gold price displayed here:

Has produced a double bottom and bullish XABCD pattern displayed above in pink on the JNUG chart.
A return to the recent highs will likely sendJNUG back into the $76 to $83 range.
Gold is, momentarily, no longer inversely correlated with the stock market. Negative real interest rates globally and the inverse correlation with USD is now the primary driving force in the price of gold.
Lower interest rates and (not QE ) QE are repricing the US dollar against major world currencies and gold:

Has produced a double bottom and bullish XABCD pattern displayed above in pink on the
A return to the recent highs will likely send
Gold is, momentarily, no longer inversely correlated with the stock market. Negative real interest rates globally and the inverse correlation with USD is now the primary driving force in the price of gold.
Lower interest rates and (not QE ) QE are repricing the US dollar against major world currencies and gold:
Powiązane publikacje
Wyłączenie odpowiedzialności
Informacje i publikacje przygotowane przez TradingView lub jego użytkowników, prezentowane na tej stronie, nie stanowią rekomendacji ani porad handlowych, inwestycyjnych i finansowych i nie powinny być w ten sposób traktowane ani wykorzystywane. Więcej informacji na ten temat znajdziesz w naszym Regulaminie.