JIOFIN Weekly Chart Analysis
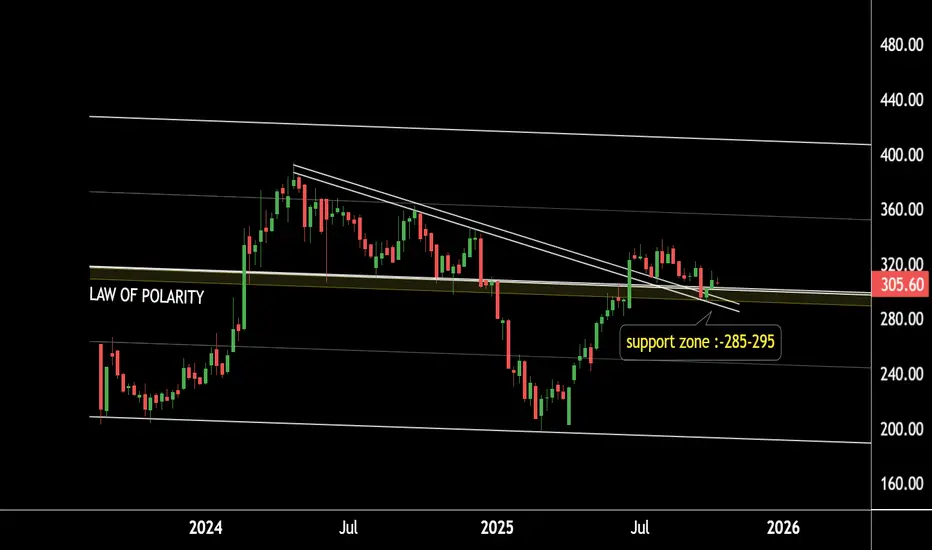
JIO Financial is showing strong price action on the weekly timeframe.
The stock is currently holding above a key law of polarity support zone around the ₹285–₹295 range.
It is also sustaining above its breakout level, with the retesting zone aligning near ₹285–₹300.
If this zone continues to hold, we may witness higher levels in JIOFIN in the coming sessions.
Conclusion:
Holding above 285–300 could trigger the next bullish leg.
@RahulSaraoge
Connect us at t.me/stridesadvisory
Connect us at t.me/stridesadvisory
Wyłączenie odpowiedzialności
Informacje i publikacje przygotowane przez TradingView lub jego użytkowników, prezentowane na tej stronie, nie stanowią rekomendacji ani porad handlowych, inwestycyjnych i finansowych i nie powinny być w ten sposób traktowane ani wykorzystywane. Więcej informacji na ten temat znajdziesz w naszym Regulaminie.