🟢  IWM | Russell 2000 – Intraday Structure Map
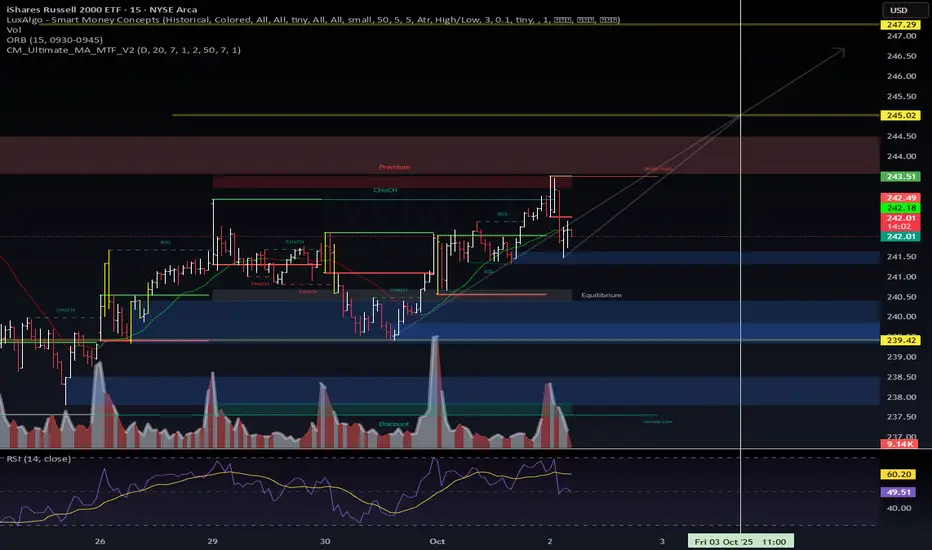
📊 Setup
Price respected the discount zone and reclaimed equilibrium.
Current rejection at premium zone (243.5) → marking liquidity grab / weak high.
RSI cooling off from 60+ levels, suggesting consolidation before next leg.
🧩 Market Structure
Multiple CHOCH & BOS signals confirm active rotation.
Higher-timeframe bias supports a possible impulse extension.
Watching wave (3) → (5) projection toward 245.0–247.2 zone.
🎯 Scenarios
Bullish Case (Primary):
Hold >242.0 → reclaim 243.5 → push to 245.0, extension 247.2.
Bearish Case (Alternate):
Fail to hold 242.0 → revisit equilibrium/demand around 239.4.
📌 Summary
IWM is building an intraday impulse wave count. Holding above 242.0 keeps the bull case intact with 245–247 in sight. Break below 241.8 flips bias back to demand re-test.
📊 Setup
Price respected the discount zone and reclaimed equilibrium.
Current rejection at premium zone (243.5) → marking liquidity grab / weak high.
RSI cooling off from 60+ levels, suggesting consolidation before next leg.
🧩 Market Structure
Multiple CHOCH & BOS signals confirm active rotation.
Higher-timeframe bias supports a possible impulse extension.
Watching wave (3) → (5) projection toward 245.0–247.2 zone.
🎯 Scenarios
Bullish Case (Primary):
Hold >242.0 → reclaim 243.5 → push to 245.0, extension 247.2.
Bearish Case (Alternate):
Fail to hold 242.0 → revisit equilibrium/demand around 239.4.
📌 Summary
WaverVanir ⚡ To grow and conquer
stocktwits.com/WaverVanir | wavervanir.com | buymeacoffee.com/wavervanir
Not Investment Advice
stocktwits.com/WaverVanir | wavervanir.com | buymeacoffee.com/wavervanir
Not Investment Advice
Wyłączenie odpowiedzialności
Informacje i publikacje nie stanowią i nie powinny być traktowane jako porady finansowe, inwestycyjne, tradingowe ani jakiekolwiek inne rekomendacje dostarczane lub zatwierdzone przez TradingView. Więcej informacji znajduje się w Warunkach użytkowania.