ITDC (India Tourism Development Corp Ltd) Weekly Chart Analysis
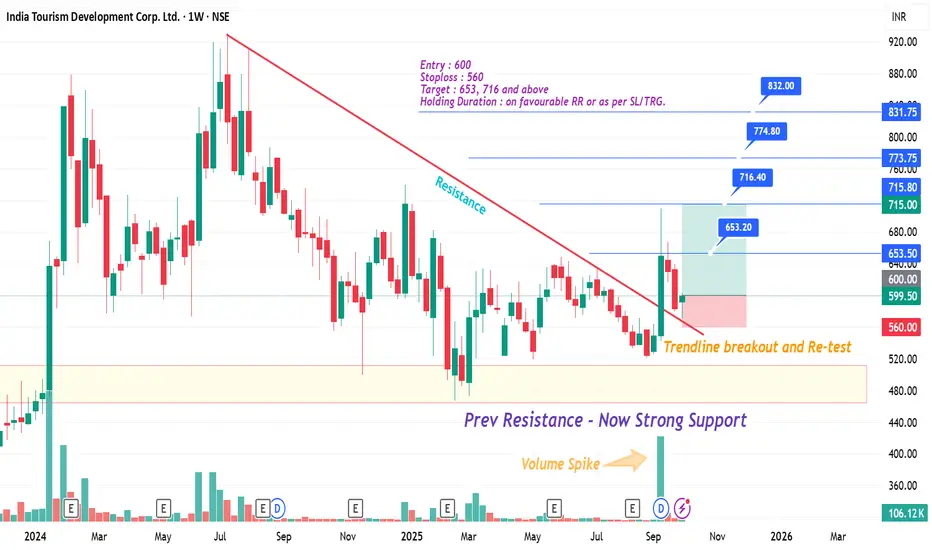
The stock has shown a trendline breakout and successful retest with strong volume support, indicating bullish momentum building up.
✅ Entry: 600
❌ Stoploss: 560
🎯 Targets: 653, 716, 774, 832
🔹 Previous resistance zone is now acting as strong support.
🔹 Volume spike confirms buying interest.
🔹 Risk-Reward looks favorable for positional traders.
This setup aligns with the tourism & hospitality sector’s ongoing revival and government focus on boosting domestic tourism.
Watchlist Addition 🚀
If momentum sustains, higher levels are possible in the medium term.
📰 Why should add :
Government initiatives to promote domestic tourism.
Upcoming festive and holiday season expected to boost travel demand.
Hospitality & tourism sector showing strong recovery trends post-pandemic.
#ITDC #Tourism #Hospitality #BreakoutStocks #SwingTrade #PositionalTrade #NSEStocks #ChartAnalysis #VolumeBreakout
Wyłączenie odpowiedzialności
Informacje i publikacje przygotowane przez TradingView lub jego użytkowników, prezentowane na tej stronie, nie stanowią rekomendacji ani porad handlowych, inwestycyjnych i finansowych i nie powinny być w ten sposób traktowane ani wykorzystywane. Więcej informacji na ten temat znajdziesz w naszym Regulaminie.