Trade Projection:
Entry Zones:
Targets:
Wyckoff Method Analysis:
Phase A (Accumulation):
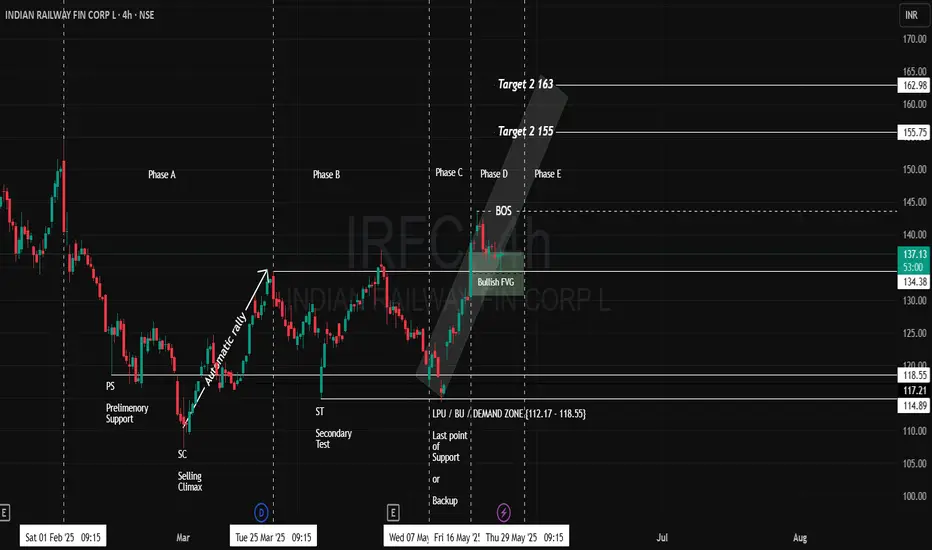
According to the Wyckoff Method, accumulation began with the stock trading in the range of 107 to 134, marking the recent swing low within Phase A.
Phase B (Testing Supply):
During this phase, the price action retested the secondary support around 114 and then rallied to 137. This movement suggests the formation of a higher high (HH) and higher low (HL) structure, although a clear confirmation of an uptrend was not yet established.
Phase C (Spring):
Phase C is typically identified by a "spring" or a false breakdown, which tests demand and confirms strength. In this case, the stock dipped to a low of 114.50 and then rallied sharply to 143.50. This rally also formed a bullish Fair Value Gap (FVG) between 130 and 140.50, indicating institutional buying interest.
Phase E (Mark-Up):
As observed, price action revisited and mitigated the bullish FVG zone between 130 and 140.50, consistent with SMC principles. The current market price is 137.02, confirming this mitigation and suggesting the mark-up phase is underway.
Disclaimer: lnkd.in/gJJDnvn2
Entry Zones:
- Primary Entry: Within the bullish FVG zone between 135 and 140.
- Secondary Entry: On a breakout above the recent swing high of 143.45, which also serves as a Break of Structure (BOS) point relative to the FVG.
Targets:
- Primary Target: 155 (approx. +12%)
- Secondary Target: 163 (approx. +20%)
- Stop loss at 125
Wyckoff Method Analysis:
Phase A (Accumulation):
According to the Wyckoff Method, accumulation began with the stock trading in the range of 107 to 134, marking the recent swing low within Phase A.
Phase B (Testing Supply):
During this phase, the price action retested the secondary support around 114 and then rallied to 137. This movement suggests the formation of a higher high (HH) and higher low (HL) structure, although a clear confirmation of an uptrend was not yet established.
Phase C (Spring):
Phase C is typically identified by a "spring" or a false breakdown, which tests demand and confirms strength. In this case, the stock dipped to a low of 114.50 and then rallied sharply to 143.50. This rally also formed a bullish Fair Value Gap (FVG) between 130 and 140.50, indicating institutional buying interest.
Phase E (Mark-Up):
As observed, price action revisited and mitigated the bullish FVG zone between 130 and 140.50, consistent with SMC principles. The current market price is 137.02, confirming this mitigation and suggesting the mark-up phase is underway.
Disclaimer: lnkd.in/gJJDnvn2
Wyłączenie odpowiedzialności
Informacje i publikacje przygotowane przez TradingView lub jego użytkowników, prezentowane na tej stronie, nie stanowią rekomendacji ani porad handlowych, inwestycyjnych i finansowych i nie powinny być w ten sposób traktowane ani wykorzystywane. Więcej informacji na ten temat znajdziesz w naszym Regulaminie.