🟣  INDUSINDBK – Symmetrical Chart Pattern Break & Reclaim Setup
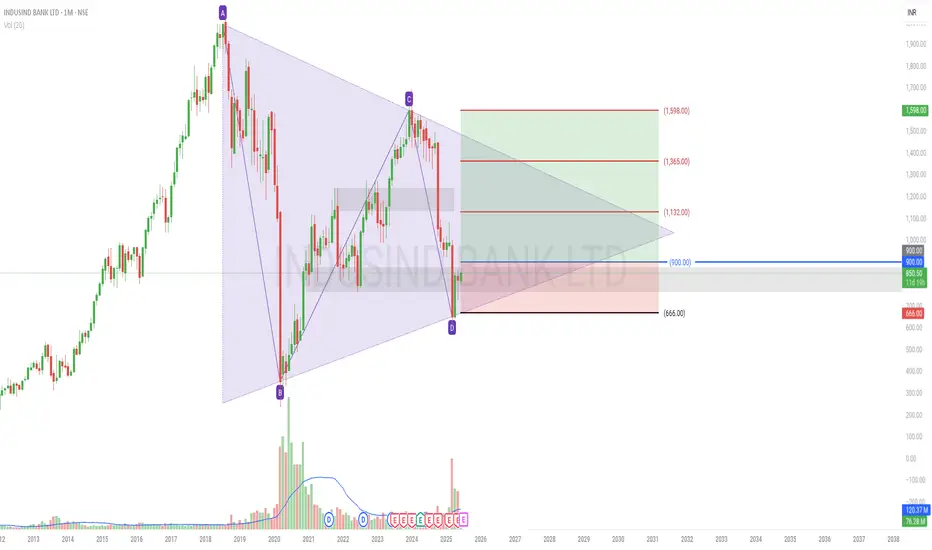
• Timeframe: Monthly
• Pattern: Symmetrical Triangle
• Outlook: Positional / 6–12 Months
• Plan of Action:
Entry: ₹900+ (on confirmation)
Stop-Loss: ₹666 (swing low / pattern invalidation)
Target 1: ₹1,132
Target 2: ₹1,365
Target 3: ₹1,598
• Why This Setup Stands Out:
Clean symmetrical triangle respected over time
Volume spike at key zone suggests potential smart money activity
₹900 is both technical resistance and a psychological level
Well-defined R:R with multi-target structure
Note: This is a positional idea — enter only on price strength above ₹900. Stay patient if below resistance.
"Trade the reclaim, not the breakdown trap."
Information shared is for educational purposes only.
A multi-year symmetrical triangle has been forming on the monthly chart and recently saw a break below lower support.
Interestingly, volume spiked around the breakdown — often signaling a potential shakeout or false breakdown.
The breakdown zone around ₹900 is now acting as resistance. If price reclaims this zone, a strong bullish breakout structure may develop.
Currently, the price is around ₹850 — watching for confirmation above ₹900 for entry.
• Timeframe: Monthly
• Pattern: Symmetrical Triangle
• Outlook: Positional / 6–12 Months
• Plan of Action:
Entry: ₹900+ (on confirmation)
Stop-Loss: ₹666 (swing low / pattern invalidation)
Target 1: ₹1,132
Target 2: ₹1,365
Target 3: ₹1,598
• Why This Setup Stands Out:
Clean symmetrical triangle respected over time
Volume spike at key zone suggests potential smart money activity
₹900 is both technical resistance and a psychological level
Well-defined R:R with multi-target structure
Note: This is a positional idea — enter only on price strength above ₹900. Stay patient if below resistance.
"Trade the reclaim, not the breakdown trap."
Information shared is for educational purposes only.
Powiązane publikacje
Wyłączenie odpowiedzialności
Informacje i publikacje przygotowane przez TradingView lub jego użytkowników, prezentowane na tej stronie, nie stanowią rekomendacji ani porad handlowych, inwestycyjnych i finansowych i nie powinny być w ten sposób traktowane ani wykorzystywane. Więcej informacji na ten temat znajdziesz w naszym Regulaminie.