Here’s a **condensed Wyckoff Accumulation Analysis** based on your most recent chart for **Indian Energy Exchange Ltd. (IEX)**:
---
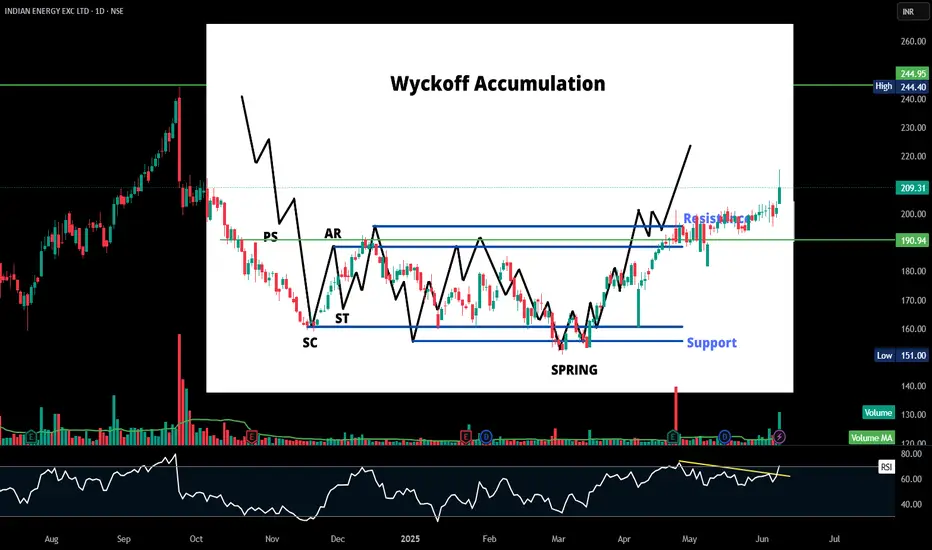
🔍 **Key Wyckoff Phases & Levels:**
* **PS (Preliminary Support):** Initial slowing of the downtrend.
* **SC (Selling Climax):** Sharp selloff forming the bottom.
* **AR (Automatic Rally):** First bounce confirming initial demand.
* **ST (Secondary Test):** Testing previous lows around SC.
* **Spring:** Fakeout below support, creating panic-selling before reversal.
* **Markup Phase:** Breakout above resistance, transitioning to uptrend.
---
📈 **Critical Price Zones:**
* **Support:** \~₹203 and 190
* **Resistance:** \~255
---
⚡ **Technical Indicators:**
* **RSI:** Above 60 with breakout, suggesting strong momentum.
* **Volume:** Increased volume on breakout candles signals institutional accumulation.
---
💡 **Conclusion:**
IEX has confirmed the Wyckoff accumulation pattern and is now in the **markup phase**, targeting ₹245 to 255 if it sustains above ₹203 and 190.
---
🔍 **Key Wyckoff Phases & Levels:**
* **PS (Preliminary Support):** Initial slowing of the downtrend.
* **SC (Selling Climax):** Sharp selloff forming the bottom.
* **AR (Automatic Rally):** First bounce confirming initial demand.
* **ST (Secondary Test):** Testing previous lows around SC.
* **Spring:** Fakeout below support, creating panic-selling before reversal.
* **Markup Phase:** Breakout above resistance, transitioning to uptrend.
---
📈 **Critical Price Zones:**
* **Support:** \~₹203 and 190
* **Resistance:** \~255
---
⚡ **Technical Indicators:**
* **RSI:** Above 60 with breakout, suggesting strong momentum.
* **Volume:** Increased volume on breakout candles signals institutional accumulation.
---
💡 **Conclusion:**
IEX has confirmed the Wyckoff accumulation pattern and is now in the **markup phase**, targeting ₹245 to 255 if it sustains above ₹203 and 190.
Wyłączenie odpowiedzialności
Informacje i publikacje przygotowane przez TradingView lub jego użytkowników, prezentowane na tej stronie, nie stanowią rekomendacji ani porad handlowych, inwestycyjnych i finansowych i nie powinny być w ten sposób traktowane ani wykorzystywane. Więcej informacji na ten temat znajdziesz w naszym Regulaminie.