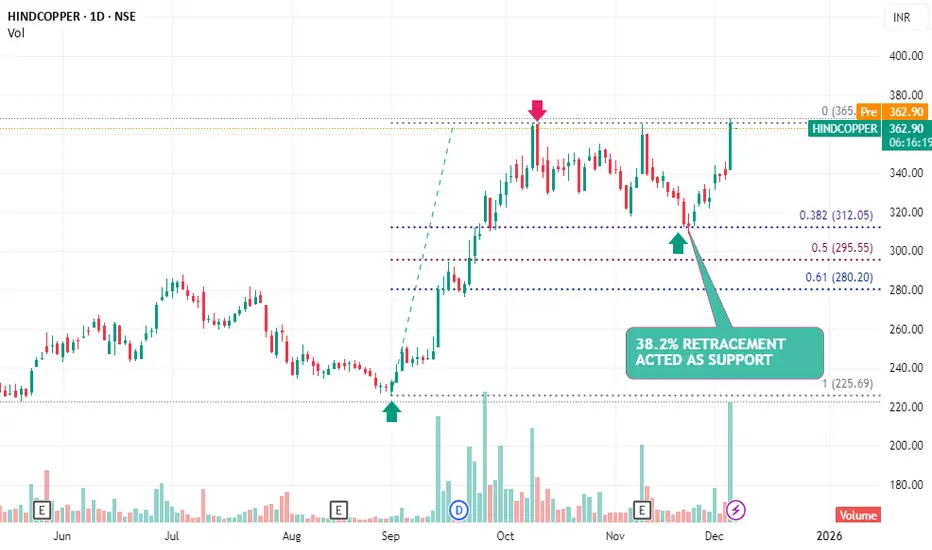
HINDCOPPER has respected the 38.2% Fibonacci retracement level, indicating that buyers are active at this key support zone. The formation of a reversal candle (DOJI) at this level strengthens the probability of a reversal from the recent corrective decline.
Technical Highlights
Price retraced to the 38.2% Fib level, which is a commonly watched support during strong uptrends.
Reversal candle at support suggests selling pressure is getting absorbed.
Indicates renewed buying interest and potential continuation of the primary uptrend.
If momentum sustains, price may attempt to retest:
Immediate resistance: Recent swing high
Next resistance zones: Trendline / supply zones (depending on chart structure)
Technical Signals
✅ 1. Fibonacci Confluence
Price halted exactly at the 38.2% retracement, indicating the pullback is shallow.
Shallow retracements often occur in strong bullish phases.
✅ 2. Reversal Candle at Support
The reversal candle (hammer / bullish engulfing / pin bar depending on chart) shows:
Strong buying interest
Absorption of selling pressure
Start of upward momentum shift
✅ 3. Trend Structure
Higher-highs and higher-lows still intact.
Price holding above short-term moving averages
Trading Plan
📌 Entry
Two entry methods depending on your trading style:
Aggressive Entry:
Enter near the current market price after the reversal candle confirmation.
Conservative Entry:
Enter above the high of the reversal candle to avoid false signals.
📌 Targets
Target 1:
Retest of recent swing high
➡ Short-term target
Wyłączenie odpowiedzialności
Informacje i publikacje nie stanowią i nie powinny być traktowane jako porady finansowe, inwestycyjne, tradingowe ani jakiekolwiek inne rekomendacje dostarczane lub zatwierdzone przez TradingView. Więcej informacji znajduje się w Warunkach użytkowania.
Wyłączenie odpowiedzialności
Informacje i publikacje nie stanowią i nie powinny być traktowane jako porady finansowe, inwestycyjne, tradingowe ani jakiekolwiek inne rekomendacje dostarczane lub zatwierdzone przez TradingView. Więcej informacji znajduje się w Warunkach użytkowania.