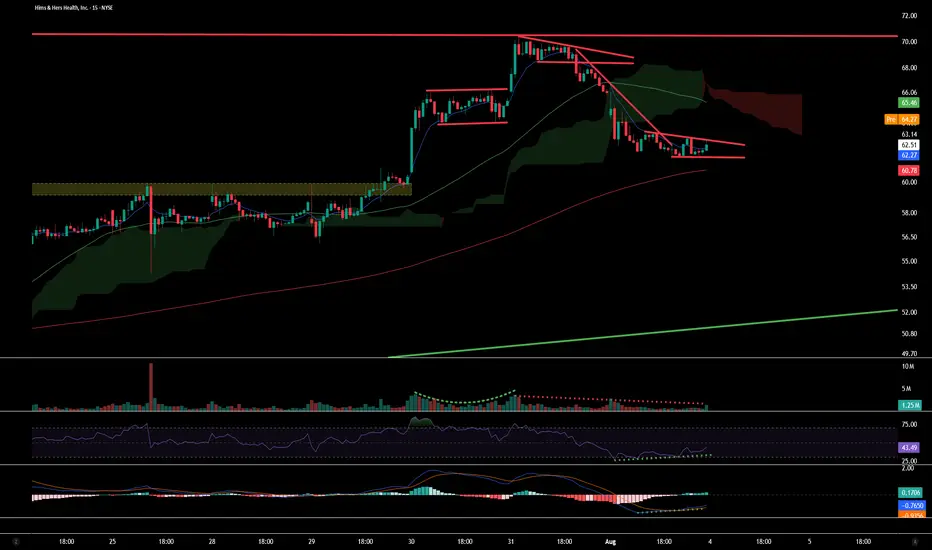
On the 15m Chart, you can see a bull flag and pennant form which broke down with confluence from MACD and RSI showing downside pressure. forming a bear pennant. However, both indicators are now flashing bullish divergence — price action is printing lower lows, while RSI and MACD are printing higher lows.
Premarket has broken above above the pennant, confirming the divergence.
Wyłączenie odpowiedzialności
Informacje i publikacje nie stanowią i nie powinny być traktowane jako porady finansowe, inwestycyjne, tradingowe ani jakiekolwiek inne rekomendacje dostarczane lub zatwierdzone przez TradingView. Więcej informacji znajduje się w Warunkach użytkowania.
Wyłączenie odpowiedzialności
Informacje i publikacje nie stanowią i nie powinny być traktowane jako porady finansowe, inwestycyjne, tradingowe ani jakiekolwiek inne rekomendacje dostarczane lub zatwierdzone przez TradingView. Więcej informacji znajduje się w Warunkach użytkowania.