📈 Key Technical Levels for the Week
Resistance Levels:
R1: ₹1,005.43
R2: ₹1,021.02
R3: ₹1,034.00
Support Levels:
S1: ₹965.32
S2: ₹949.73
S3: ₹937.47
A close above ₹1,005.43 could indicate a breakout, while a drop below ₹965.32 may signal a potential reversal.
📊 Technical Indicators
RSI (14): 77.88 — Overbought, suggesting potential for a pullback.
MACD: Positive, indicating bullish momentum.
CCI: 202.29 — Overbought, aligning with the RSI reading.
ADX: 32.18 — Bullish trend strength.
The stock is trading above its 20-day and 50-day moving averages, indicating a bullish trend.
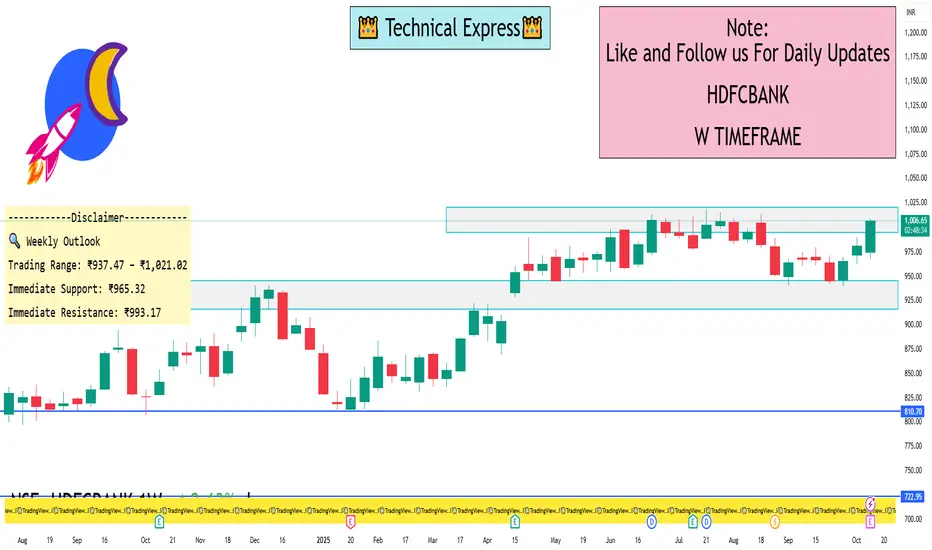
🔍 Weekly Outlook
Trading Range: ₹937.47 – ₹1,021.02
Immediate Support: ₹965.32
Immediate Resistance: ₹993.17
A close above ₹1,005.43 could lead to further gains, while a close below ₹965.32 may suggest a bearish reversal.
Resistance Levels:
R1: ₹1,005.43
R2: ₹1,021.02
R3: ₹1,034.00
Support Levels:
S1: ₹965.32
S2: ₹949.73
S3: ₹937.47
A close above ₹1,005.43 could indicate a breakout, while a drop below ₹965.32 may signal a potential reversal.
📊 Technical Indicators
RSI (14): 77.88 — Overbought, suggesting potential for a pullback.
MACD: Positive, indicating bullish momentum.
CCI: 202.29 — Overbought, aligning with the RSI reading.
ADX: 32.18 — Bullish trend strength.
The stock is trading above its 20-day and 50-day moving averages, indicating a bullish trend.
🔍 Weekly Outlook
Trading Range: ₹937.47 – ₹1,021.02
Immediate Support: ₹965.32
Immediate Resistance: ₹993.17
A close above ₹1,005.43 could lead to further gains, while a close below ₹965.32 may suggest a bearish reversal.
I built a Buy & Sell Signal Indicator with 85% accuracy.
📈 Get access via DM or
WhatsApp: wa.link/d997q0
Contact - +91 76782 40962
| Email: techncialexpress@gmail.com
| Script Coder | Trader | Investor | From India
📈 Get access via DM or
WhatsApp: wa.link/d997q0
Contact - +91 76782 40962
| Email: techncialexpress@gmail.com
| Script Coder | Trader | Investor | From India
Powiązane publikacje
Wyłączenie odpowiedzialności
Informacje i publikacje nie stanowią i nie powinny być traktowane jako porady finansowe, inwestycyjne, tradingowe ani jakiekolwiek inne rekomendacje dostarczane lub zatwierdzone przez TradingView. Więcej informacji znajduje się w Warunkach użytkowania.