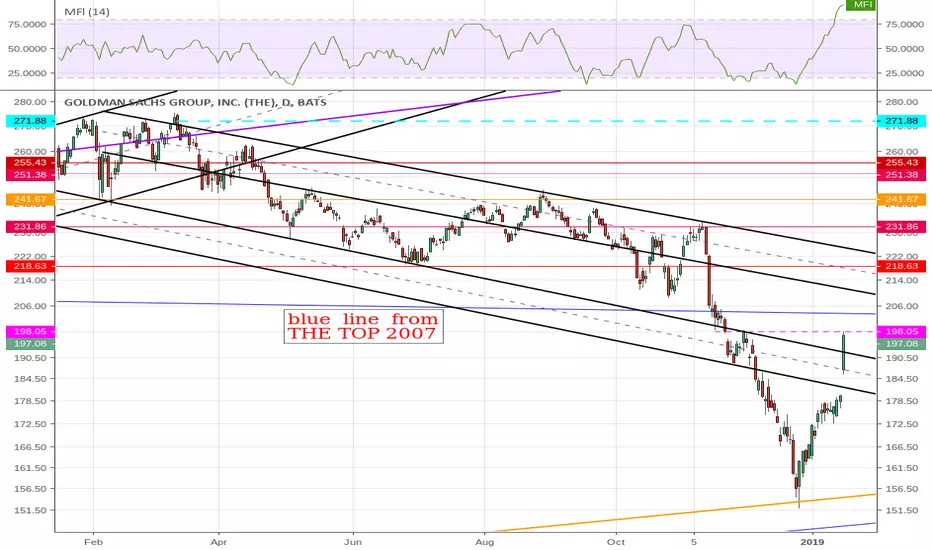
GAP resistance again
Blue line from the highest high and down trending
[the recent high breaking this trend all QE ? ]
channels are resistance zones from gaps and hi/low peaks [ R&S}
[ hate i can not see chart while making comments ! ]
seeing if secondary resistance lines are S&R - noticing gaps in these channels occasionally
Wyłączenie odpowiedzialności
Informacje i publikacje nie stanowią i nie powinny być traktowane jako porady finansowe, inwestycyjne, tradingowe ani jakiekolwiek inne rekomendacje dostarczane lub zatwierdzone przez TradingView. Więcej informacji znajduje się w Warunkach użytkowania.
Wyłączenie odpowiedzialności
Informacje i publikacje nie stanowią i nie powinny być traktowane jako porady finansowe, inwestycyjne, tradingowe ani jakiekolwiek inne rekomendacje dostarczane lub zatwierdzone przez TradingView. Więcej informacji znajduje się w Warunkach użytkowania.
