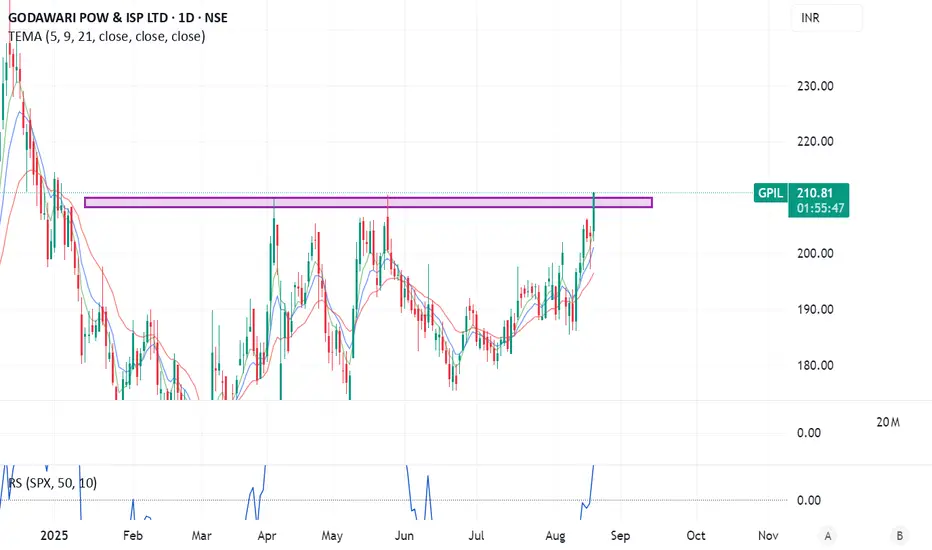
Technical Analysis (Daily Chart)
Indicator Setup: The price is trading above the 5, 9 & 13 EMAs—all aligned bullishly—indicating a positive trend.
Key Levels:
Resistance Turned Support: Around ₹203–205
Next Resistance / Target Zone: Near ₹217–220 (recent swing high)
Momentum: The breakout above the consolidation zone is showing strength.
Trade Plan:
Entry: On close above ₹206 (valid breakout confirmation)
Stop-Loss: ₹198–200 (below EMA cluster/support)
Targets:
Target 1: ₹217–220
Target 2: ₹235+ (stretch)
Fundamental Highlights
Key data from consolidated financials:
Market Cap: ~₹13,900 Cr
Valuation:
P/E approximately 18.6× — attractive vs sector peers (~30×)
P/B around 2.9–3.1×
Profitability:
ROCE: ~23.3%
ROE: ~17.3%
Profitability Trends:
FY24 consolidated profit: ~₹917 Cr; FY25: ~₹770 Cr (YoY decline ~16%)
Growth Metrics:
5-year sales growth: ~10% (modest)
Q1 FY26 net margin: ~17.7%
Strengths:
Virtually debt-free—robust balance sheet
Healthy returns and steady margin profile
Weaknesses:
Sluggish top-line growth
Moderate payout/investment intensity
Wyłączenie odpowiedzialności
Informacje i publikacje nie stanowią i nie powinny być traktowane jako porady finansowe, inwestycyjne, tradingowe ani jakiekolwiek inne rekomendacje dostarczane lub zatwierdzone przez TradingView. Więcej informacji znajduje się w Warunkach użytkowania.
Wyłączenie odpowiedzialności
Informacje i publikacje nie stanowią i nie powinny być traktowane jako porady finansowe, inwestycyjne, tradingowe ani jakiekolwiek inne rekomendacje dostarczane lub zatwierdzone przez TradingView. Więcej informacji znajduje się w Warunkach użytkowania.