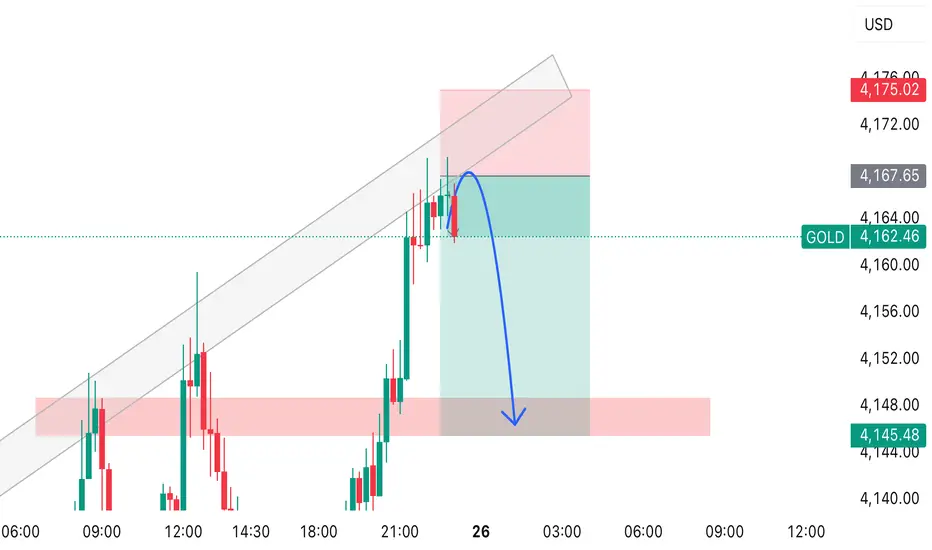
This TradingView chart shows GOLD price action approaching a resistance zone near 4167–4170 USD.
Price has been moving inside an ascending channel, shown with grey trendlines.
At the top of the channel, a rejection candle appears, and you’ve drawn a blue arrow indicating your expected move:
📉 Expected Move
• Price is expected to drop from the resistance zone.
• The arrow shows a move down towards the support demand zone near 4145–4150 USD (highlighted in red).
Zlecenie aktywne
Active Transakcja zamknięta: osiągnięto wyznaczony cel
Target reached 🔥Wyłączenie odpowiedzialności
Informacje i publikacje nie stanowią i nie powinny być traktowane jako porady finansowe, inwestycyjne, tradingowe ani jakiekolwiek inne rekomendacje dostarczane lub zatwierdzone przez TradingView. Więcej informacji znajduje się w Warunkach użytkowania.
Wyłączenie odpowiedzialności
Informacje i publikacje nie stanowią i nie powinny być traktowane jako porady finansowe, inwestycyjne, tradingowe ani jakiekolwiek inne rekomendacje dostarczane lub zatwierdzone przez TradingView. Więcej informacji znajduje się w Warunkach użytkowania.