"Gold Retests Key Level – Is This the Start of a Bullish Run?"
🔹Gold (XAU/USD) – 30-Minute Chart Technical Outlook
▪️Market Structure:
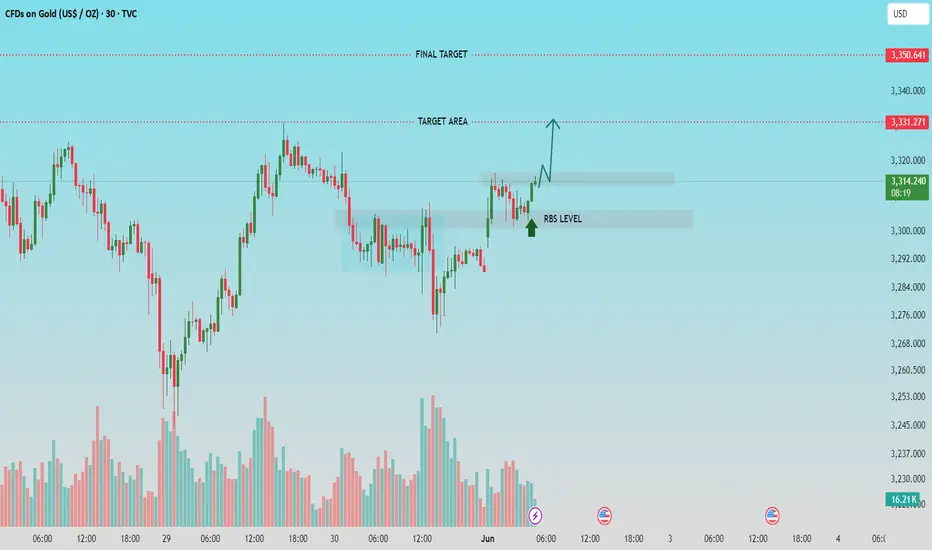
Gold is currently showing signs of bullish continuation following a breakout above a previous resistance area, now turned RBS (Resistance Becomes Support) level near $3,308-$3,310.
▪️Key Levels:
* RBS Level: $3,308 (prior resistance, now acting as support)
* Target Area: $3,331
* Final Target: $3,351
▪️Price Action Insight:
After a brief consolidation, price has broken above short-term resistance and is retesting the RBS level, confirming it as new support. Bullish momentum is indicated by the rising volume during the breakout phase and a strong bullish candle retesting support.
▪️Trade Bias:
* Bullish Bias: As long as price holds above the RBS zone, continuation toward the target area at $3,331 is likely.
* If momentum sustains, final target at $3,351 remains in sight.
* A breakdown below the RBS level would invalidate this bullish setup and suggest reevaluation.
▪️Conclusion:
The current structure favors buyers, with confirmation of support at the RBS level providing a potential low-risk entry for a long position. Targets are clearly defined, with favorable risk-to-reward as long as price sustains above the breakout zone.
🔹Community Insight:
If you find this analysis helpful in your trading journey, feel free to share your thoughts or questions in the comments. Let’s work together to maintain a disciplined, technical approach to the markets.
▪️Follow for regular updates and trade setups.
▪️Market Structure:
Gold is currently showing signs of bullish continuation following a breakout above a previous resistance area, now turned RBS (Resistance Becomes Support) level near $3,308-$3,310.
▪️Key Levels:
* RBS Level: $3,308 (prior resistance, now acting as support)
* Target Area: $3,331
* Final Target: $3,351
▪️Price Action Insight:
After a brief consolidation, price has broken above short-term resistance and is retesting the RBS level, confirming it as new support. Bullish momentum is indicated by the rising volume during the breakout phase and a strong bullish candle retesting support.
▪️Trade Bias:
* Bullish Bias: As long as price holds above the RBS zone, continuation toward the target area at $3,331 is likely.
* If momentum sustains, final target at $3,351 remains in sight.
* A breakdown below the RBS level would invalidate this bullish setup and suggest reevaluation.
▪️Conclusion:
The current structure favors buyers, with confirmation of support at the RBS level providing a potential low-risk entry for a long position. Targets are clearly defined, with favorable risk-to-reward as long as price sustains above the breakout zone.
🔹Community Insight:
If you find this analysis helpful in your trading journey, feel free to share your thoughts or questions in the comments. Let’s work together to maintain a disciplined, technical approach to the markets.
▪️Follow for regular updates and trade setups.
Zlecenie aktywne
Uwaga
Transakcja zamknięta: osiągnięto wyznaczony cel
💸FREE FOREX Signals in Telegram : t.me/FxInsightsHub0
🔹Join Our Telegram Channel, Pure Price Action Based Signals With Chart Analysis.
t.me/FxInsightsHub0
🚀FREE CRYPTO Signals In Telegram: t.me/FxInsightsHub0
🔹Join Our Telegram Channel, Pure Price Action Based Signals With Chart Analysis.
t.me/FxInsightsHub0
🚀FREE CRYPTO Signals In Telegram: t.me/FxInsightsHub0
Powiązane publikacje
Wyłączenie odpowiedzialności
Informacje i publikacje przygotowane przez TradingView lub jego użytkowników, prezentowane na tej stronie, nie stanowią rekomendacji ani porad handlowych, inwestycyjnych i finansowych i nie powinny być w ten sposób traktowane ani wykorzystywane. Więcej informacji na ten temat znajdziesz w naszym Regulaminie.