🔹 Technical Analysis Of XAUUSD (GOLD)
▪️Chart Pattern: Head and Shoulders
▪️Pattern Breakdown
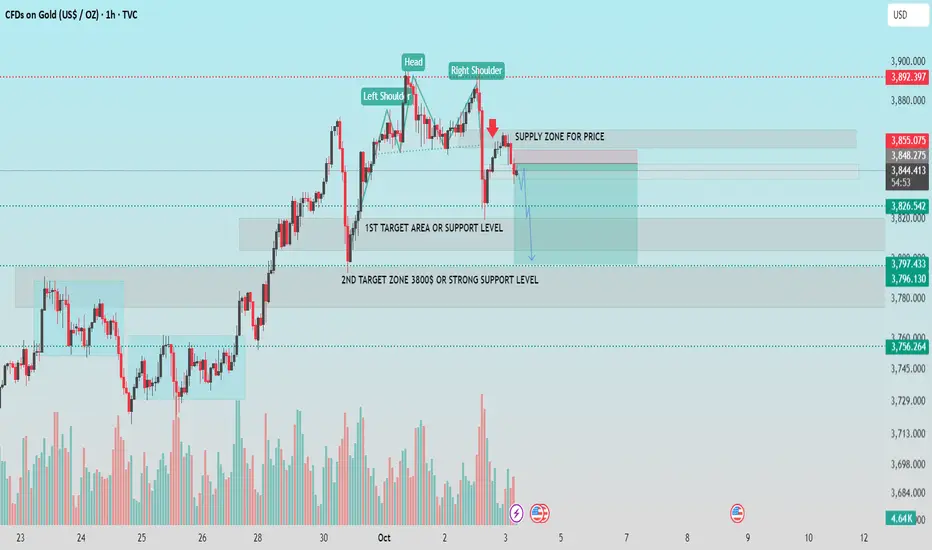
▫️ A Head and Shoulders pattern has formed, signaling a potential bearish reversal.
▫️ Left Shoulder: Formed around $3,848
▫️Head: Peaked near $3,870+
▫️Right Shoulder: Lower high, aligning with the left shoulder
This classic reversal pattern suggests a weakening bullish momentum and potential downside.
▪️Key Zones
▪️ Supply Zone for Price (Resistance):
$3,848 – $3,855
Price has already reacted from this zone, confirming selling pressure.
▫️ 1st Target Area / Support Level:
Around $3,826
Short-term support; if broken, further decline is likely.
▫️ 2nd Target Zone / Strong Support:
$3,796 – $3,780 range
A historically strong support zone and key demand area
▪️ Volume Analysis
Elevated volume during the right shoulder drop suggests increased selling interest, adding strength to the bearish signal.
▪️ Outlook
Bearish Bias favored unless price reclaims and closes above the supply zone.
Watch for a break below $3,826 for continuation towards $3,796 or lower.
If this helpful for you, press the like button.
▪️Chart Pattern: Head and Shoulders
▪️Pattern Breakdown
▫️ A Head and Shoulders pattern has formed, signaling a potential bearish reversal.
▫️ Left Shoulder: Formed around $3,848
▫️Head: Peaked near $3,870+
▫️Right Shoulder: Lower high, aligning with the left shoulder
This classic reversal pattern suggests a weakening bullish momentum and potential downside.
▪️Key Zones
▪️ Supply Zone for Price (Resistance):
$3,848 – $3,855
Price has already reacted from this zone, confirming selling pressure.
▫️ 1st Target Area / Support Level:
Around $3,826
Short-term support; if broken, further decline is likely.
▫️ 2nd Target Zone / Strong Support:
$3,796 – $3,780 range
A historically strong support zone and key demand area
▪️ Volume Analysis
Elevated volume during the right shoulder drop suggests increased selling interest, adding strength to the bearish signal.
▪️ Outlook
Bearish Bias favored unless price reclaims and closes above the supply zone.
Watch for a break below $3,826 for continuation towards $3,796 or lower.
If this helpful for you, press the like button.
Zlecenie aktywne
from 3858, supply zoneUwaga
just hold your trades from supply zoneTransakcja zakończona: osiągnięto poziom stop
💸FREE FOREX Signals in Telegram : t.me/FxInsightsHub0
🔹Join Our Telegram Channel, Pure Price Action Based Signals With Chart Analysis.
t.me/FxInsightsHub0
🚀FREE CRYPTO Signals In Telegram: t.me/FxInsightsHub0
🔹Join Our Telegram Channel, Pure Price Action Based Signals With Chart Analysis.
t.me/FxInsightsHub0
🚀FREE CRYPTO Signals In Telegram: t.me/FxInsightsHub0
Powiązane publikacje
Wyłączenie odpowiedzialności
Informacje i publikacje przygotowane przez TradingView lub jego użytkowników, prezentowane na tej stronie, nie stanowią rekomendacji ani porad handlowych, inwestycyjnych i finansowych i nie powinny być w ten sposób traktowane ani wykorzystywane. Więcej informacji na ten temat znajdziesz w naszym Regulaminie.