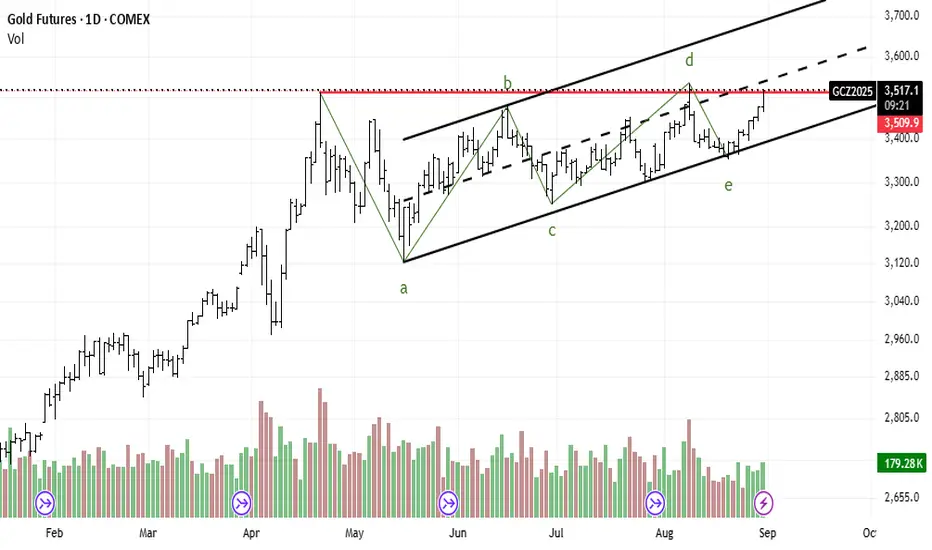
Gold futures (GC) are currently exhibiting a classic consolidation pattern on the daily timeframe, specifically a contracting triangle. This formation, identified as a standard a-b-c-d-e Elliott Wave sequence, is functioning as a continuation pattern following the strong uptrend observed from Q1 to Q2 2025.
The accompanying decline in trading volume throughout the pattern's development reinforces the validity of this consolidation phase, suggesting that market energy is accumulating for a significant directional move.
Key Levels to Monitor:
Confirmation (Trigger): A decisive daily close above the key resistance zone of $3,525. This breakout should ideally be supported by a surge in volume.
Price Target: A successful breakout projects an initial, measured target in the $3,900 - $3,950 range.
Invalidation: The bullish thesis would be invalidated upon a breakdown below the pattern's lower trendline support, specifically a close below the wave 'e' low at approximately $3,400.
From a macroeconomic perspective, this technical setup is highly sensitive to upcoming economic data. A catalyst in the form of weaker-than-expected labor or inflation figures could accelerate the anticipated bullish breakout.
Wyłączenie odpowiedzialności
Informacje i publikacje przygotowane przez TradingView lub jego użytkowników, prezentowane na tej stronie, nie stanowią rekomendacji ani porad handlowych, inwestycyjnych i finansowych i nie powinny być w ten sposób traktowane ani wykorzystywane. Więcej informacji na ten temat znajdziesz w naszym Regulaminie.