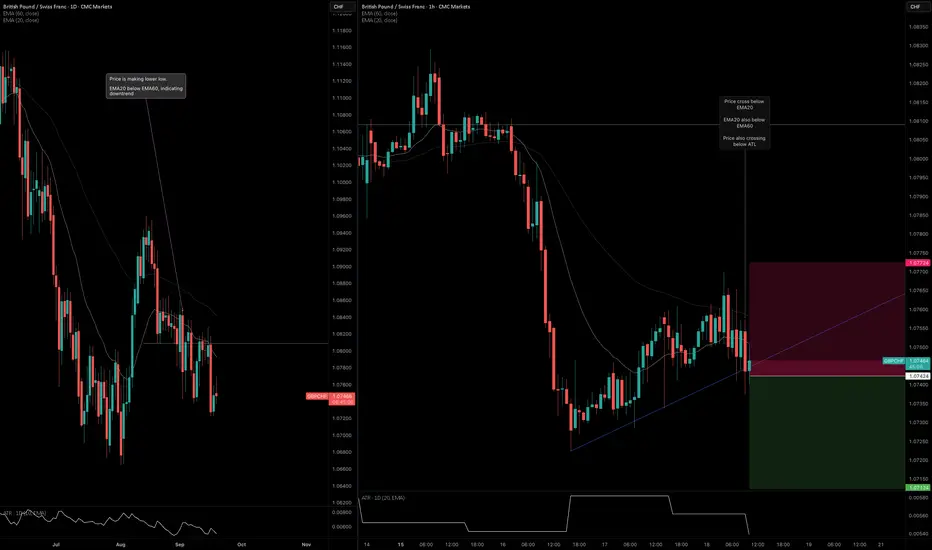
I noticed confluence over on the GBPCHF pair. Here's the breakdown on the daily and H1 timeframes.
Daily Timeframe:
H1 Timeframe:
Daily Timeframe:
- EMA20 is below EMA60 > downtrend structure
- Price is also bouncing below EMA20 > confirms downtrend
- Price also holding below HTL based on previous end at bearish candle
H1 Timeframe:
- Price is exiting the EMA band > momentum has high potential to accelerate lower
- EMA20 is below EMA60 and expanding > confluence that momentum is accelerating
Wyłączenie odpowiedzialności
Informacje i publikacje nie stanowią i nie powinny być traktowane jako porady finansowe, inwestycyjne, tradingowe ani jakiekolwiek inne rekomendacje dostarczane lub zatwierdzone przez TradingView. Więcej informacji znajduje się w Warunkach użytkowania.
Wyłączenie odpowiedzialności
Informacje i publikacje nie stanowią i nie powinny być traktowane jako porady finansowe, inwestycyjne, tradingowe ani jakiekolwiek inne rekomendacje dostarczane lub zatwierdzone przez TradingView. Więcej informacji znajduje się w Warunkach użytkowania.