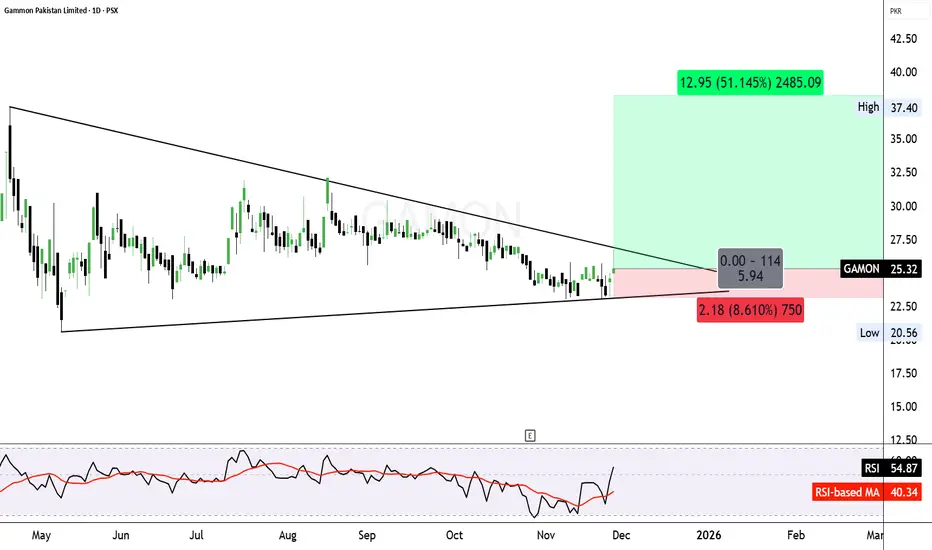
GAMON is breaking out of a long symmetrical triangle on the daily chart, showing fresh bullish momentum as price moves above the upper trendline. With RSI also crossing above its moving average, momentum supports a potential move toward the projected target near 37.40, offering strong upside potential. A protective stop near 23.14 keeps downside risk controlled if the breakout fails.
Disclaimer: This analysis is for educational purposes only and is not financial advice. Always conduct your own research before making any investment decisions.
Disclaimer: This analysis is for educational purposes only and is not financial advice. Always conduct your own research before making any investment decisions.
TradeFlow Advisors
Wyłączenie odpowiedzialności
Informacje i publikacje nie stanowią i nie powinny być traktowane jako porady finansowe, inwestycyjne, tradingowe ani jakiekolwiek inne rekomendacje dostarczane lub zatwierdzone przez TradingView. Więcej informacji znajduje się w Warunkach użytkowania.