Zaktualizowano
FSR breaks out of Descending Triangle LONG
$NYSE:FSR
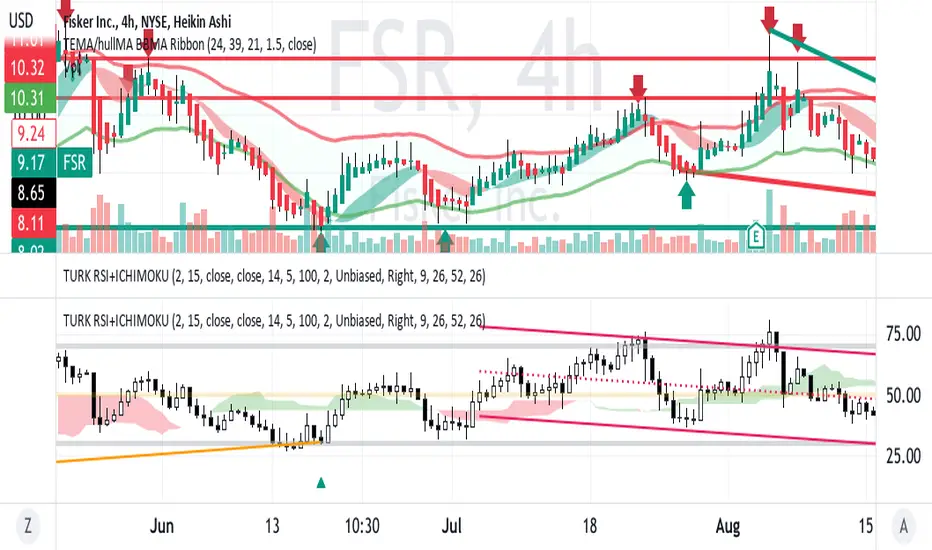
On the 4H chart with trendlines drawn FSR is trending up out of the triangle.
The RSI with Ichimoku indicator shows the confirmatory increasing relative strength
in a move from under to over the cloud.
All in all, this appears to be a swing long set up with a near upside of 20 %
or about $12 .
On the 4H chart with trendlines drawn FSR is trending up out of the triangle.
The RSI with Ichimoku indicator shows the confirmatory increasing relative strength
in a move from under to over the cloud.
All in all, this appears to be a swing long set up with a near upside of 20 %
or about $12 .
Zlecenie aktywne
FSR had a nice 3% jump with a bullish candle after a doji showing buyers are taking trades.Wyłączenie odpowiedzialności
Informacje i publikacje nie stanowią i nie powinny być traktowane jako porady finansowe, inwestycyjne, tradingowe ani jakiekolwiek inne rekomendacje dostarczane lub zatwierdzone przez TradingView. Więcej informacji znajduje się w Warunkach użytkowania.
Wyłączenie odpowiedzialności
Informacje i publikacje nie stanowią i nie powinny być traktowane jako porady finansowe, inwestycyjne, tradingowe ani jakiekolwiek inne rekomendacje dostarczane lub zatwierdzone przez TradingView. Więcej informacji znajduje się w Warunkach użytkowania.