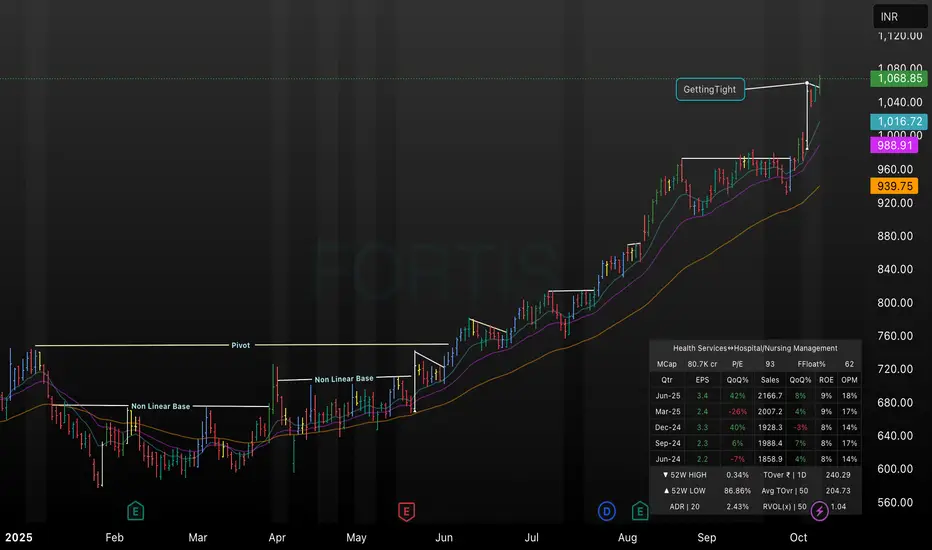
This TradingView daily chart for Fortis (2025) illustrates key technical setups including two clearly labeled non-linear base formations, a major pivot breakout, and subsequent price consolidation zones. The chart captures the transition from range-bound action to a strong bullish move, highlighting the “Getting Tight” pattern before this recent surge. Additional metrics such as moving averages, volume overlays, and stock fundamentals are visible, providing a comprehensive overview for swing or positional traders seeking technical clarity.
Wyłączenie odpowiedzialności
Informacje i publikacje przygotowane przez TradingView lub jego użytkowników, prezentowane na tej stronie, nie stanowią rekomendacji ani porad handlowych, inwestycyjnych i finansowych i nie powinny być w ten sposób traktowane ani wykorzystywane. Więcej informacji na ten temat znajdziesz w naszym Regulaminie.