Good Morning,
Hope all is well. Quick review on Flex.
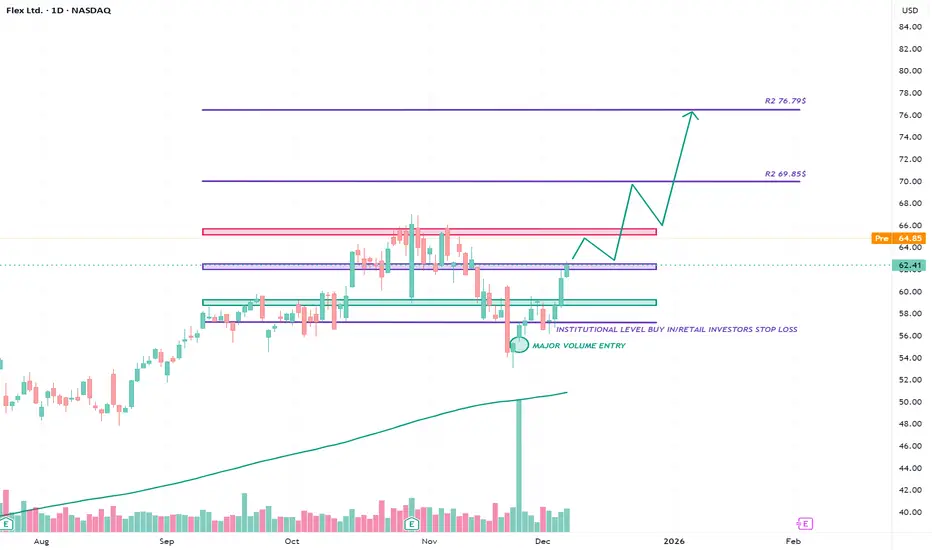
Scenario 1 — Bullish Continuation (Primary Outlook)
Flex shows strong signs of trend restoration after reclaiming the $60–62 institutional demand zone, where a major volume spike suggests accumulation rather than distribution. If price holds above this zone and breaks through the $64.50–$65.50 supply area, momentum could accelerate toward the next resistance layers at $69.85 and ultimately $76.79, completing a measured bullish continuation. Supportive technical factors include higher lows forming, MACD staying above zero on intraday charts, and ADX turning up, all pointing toward sustained upward movement.
Scenario 2 — Neutral / Range Before Breakout
If buyers temporarily lose strength but the demand zone remains intact, Flex may consolidate in a sideways range between $58.50 and $65.50. This would represent an accumulation phase where institutions absorb supply before initiating the next leg upward. In this scenario, price may retest the red resistance band multiple times while maintaining support at the purple and teal levels. As long as the $58–60 zone holds, the broader structure continues to favor an eventual bullish breakout toward higher targets.
Scenario 3 — Bearish Breakdown (Low Probability but Important)
The only meaningful bearish risk lies in a breakdown below the $58–59 institutional level — the zone marked by major volume and stop-loss placement for early buyers. A loss of this level would invalidate the accumulation thesis and imply that smart money is exiting rather than positioning for upside. If price closes below $58 and retests it from underneath as resistance, downside targets open toward $55 and possibly $52.50, the next major historical support areas. Confirmation would come from a drop in MACD below zero and increasing selling volume.
Trade Safe!
Enjoy!
Hope all is well. Quick review on Flex.
Scenario 1 — Bullish Continuation (Primary Outlook)
Flex shows strong signs of trend restoration after reclaiming the $60–62 institutional demand zone, where a major volume spike suggests accumulation rather than distribution. If price holds above this zone and breaks through the $64.50–$65.50 supply area, momentum could accelerate toward the next resistance layers at $69.85 and ultimately $76.79, completing a measured bullish continuation. Supportive technical factors include higher lows forming, MACD staying above zero on intraday charts, and ADX turning up, all pointing toward sustained upward movement.
Scenario 2 — Neutral / Range Before Breakout
If buyers temporarily lose strength but the demand zone remains intact, Flex may consolidate in a sideways range between $58.50 and $65.50. This would represent an accumulation phase where institutions absorb supply before initiating the next leg upward. In this scenario, price may retest the red resistance band multiple times while maintaining support at the purple and teal levels. As long as the $58–60 zone holds, the broader structure continues to favor an eventual bullish breakout toward higher targets.
Scenario 3 — Bearish Breakdown (Low Probability but Important)
The only meaningful bearish risk lies in a breakdown below the $58–59 institutional level — the zone marked by major volume and stop-loss placement for early buyers. A loss of this level would invalidate the accumulation thesis and imply that smart money is exiting rather than positioning for upside. If price closes below $58 and retests it from underneath as resistance, downside targets open toward $55 and possibly $52.50, the next major historical support areas. Confirmation would come from a drop in MACD below zero and increasing selling volume.
Trade Safe!
Enjoy!
Wyłączenie odpowiedzialności
Informacje i publikacje nie stanowią i nie powinny być traktowane jako porady finansowe, inwestycyjne, tradingowe ani jakiekolwiek inne rekomendacje dostarczane lub zatwierdzone przez TradingView. Więcej informacji znajduje się w Warunkach użytkowania.
Wyłączenie odpowiedzialności
Informacje i publikacje nie stanowią i nie powinny być traktowane jako porady finansowe, inwestycyjne, tradingowe ani jakiekolwiek inne rekomendacje dostarczane lub zatwierdzone przez TradingView. Więcej informacji znajduje się w Warunkach użytkowania.