Context:
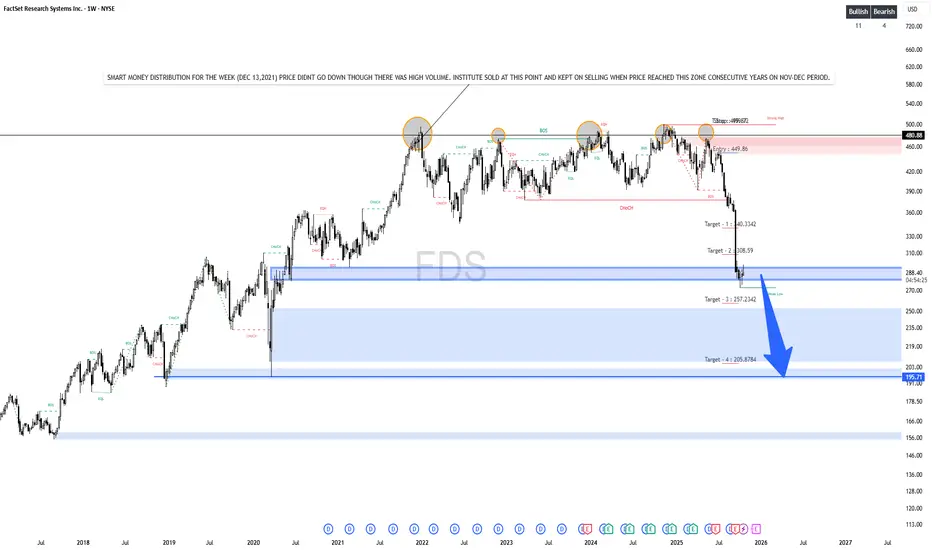
The chart highlights a Smart Money Distribution phase around Dec 2021, where institutions sold heavily near the $480–$500 zone.
Each time price reached this zone during Nov–Dec in consecutive years, it faced institutional selling pressure.
🧠 Market Structure & Analysis:
Multiple Equal Highs (EQH) and Breaks of Structure (BOS) confirm distribution and shift from bullish to bearish trend.
A major Change of Character (CHoCH) occurred, signaling a trend reversal.
The chart shows a clear downtrend with consecutive lower highs and lower lows.
📉 Trade Setup:
Entry Zone: Around $450 after the CHoCH and BOS confirmation.
Distribution Zone (Institutional Sell Zone): $460–$500 range (highlighted red box).
Targets:
🎯 Target 1: $340.33 (hit)
🎯 Target 2: $308.59 (hit)
🎯 Target 3: $257.23 (approaching support)
🎯 Target 4: $205.87 (final target – marked by the large blue arrow)**
⚠️ Key Notes:
Current price (~$287) is near Target 3 zone, a potential temporary support area.
If liquidity breaks below $257, momentum could extend to $205–$210 (major demand zone from 2020).
Volume analysis suggests smart money continues offloading positions; little evidence of accumulation yet.
🧭 Bias:
Primary Bias: Bearish
Short-term Outlook: Potential small bounce from $257–$287 zone.
Wyłączenie odpowiedzialności
Informacje i publikacje przygotowane przez TradingView lub jego użytkowników, prezentowane na tej stronie, nie stanowią rekomendacji ani porad handlowych, inwestycyjnych i finansowych i nie powinny być w ten sposób traktowane ani wykorzystywane. Więcej informacji na ten temat znajdziesz w naszym Regulaminie.