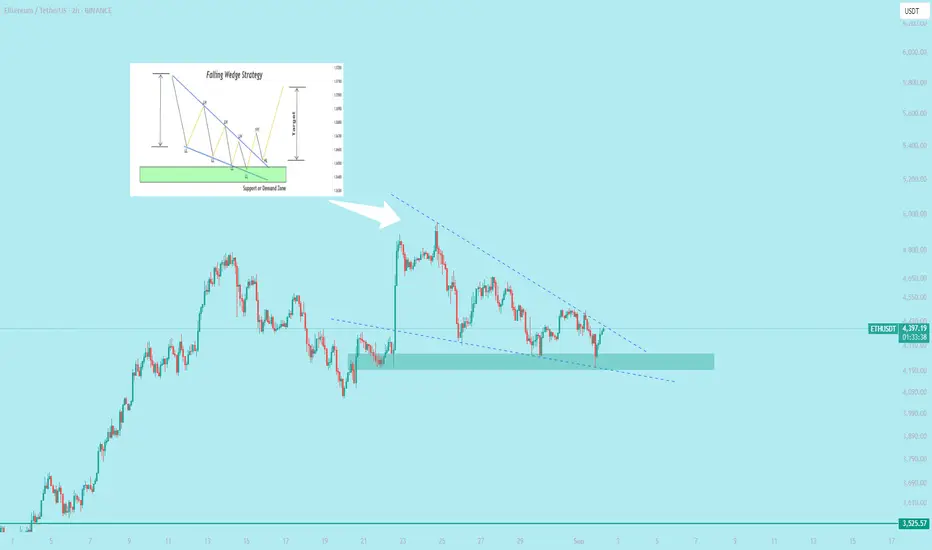
A **falling wedge pattern** is a bullish chart pattern in technical analysis. It forms when the price makes lower highs and lower lows, but the range narrows as the lines converge, creating a wedge shape sloping downward.
**Key Points:**
- **Bullish Signal**: Indicates a potential price reversal or breakout to the upside.
- **Structure**: Two converging trendlines—support (lower) and resistance (upper)—sloping downward.
- **Breakout**: Typically, the price breaks above the upper resistance line, signaling a bullish move.
- **Volume**: Often decreases as the wedge forms, then spikes on breakout.
- **Confirmation**: Wait for a breakout above resistance with strong volume for confirmation.
**Trading Tip**: Enter a long position after the breakout, with a stop-loss below the lower trendline. Target price is often the height of the wedge added to the breakout point.
Example: If Sahara stock shows a falling wedge, watch for a breakout above the upper trendline with high volume for a potential buy signal.
Wyłączenie odpowiedzialności
Informacje i publikacje przygotowane przez TradingView lub jego użytkowników, prezentowane na tej stronie, nie stanowią rekomendacji ani porad handlowych, inwestycyjnych i finansowych i nie powinny być w ten sposób traktowane ani wykorzystywane. Więcej informacji na ten temat znajdziesz w naszym Regulaminie.