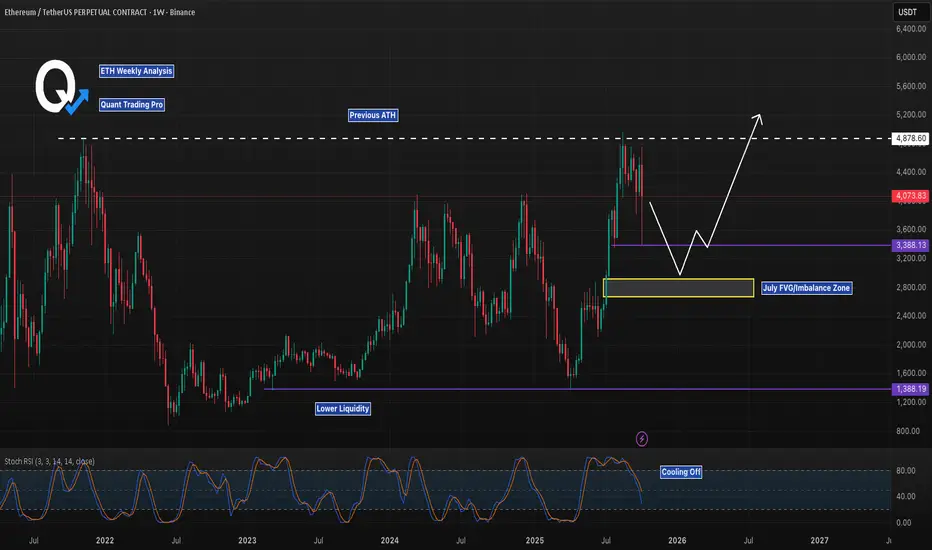
Ethereum (ETH/USD) on the weekly chart recently retested the July FVG imbalance zone around $3,388.13, showing a strong bounce after hitting lower liquidity near $1,600.00. The bullish scenario points to a potential move toward the previous ATH at $4,878.60 if momentum builds, especially with Stoch RSI cooling off from overbought levels. Conversely, watch for a bearish pullback if resistance holds at $3,388.13, targeting lower liquidity again—key levels to monitor are $3,388.13 and $1,600.00!
Explore 5,000 Strategies at quanttradingpro.com
Search for the most profitable, lowest risk by symbol!
Search by indicators like Supertrend, Ichimoku, macd.
Join our discord discord.gg/2systG9frc
We provide education & tools.
Search for the most profitable, lowest risk by symbol!
Search by indicators like Supertrend, Ichimoku, macd.
Join our discord discord.gg/2systG9frc
We provide education & tools.
Wyłączenie odpowiedzialności
Informacje i publikacje nie stanowią i nie powinny być traktowane jako porady finansowe, inwestycyjne, tradingowe ani jakiekolwiek inne rekomendacje dostarczane lub zatwierdzone przez TradingView. Więcej informacji znajduje się w Warunkach użytkowania.