Ether Futures just pulled an interesting move — it finally pushed above the upper edge of the stubborn gap that has been capping price below 2853.5.
For a while, ETH was sliding down the lower Bollinger Band like a chilled skier who forgot how to turn. Now? It just jumped over the fence.
This changes things. A gap break doesn’t guarantee a trend reversal, but it’s the market’s way of saying:
“Hey, sellers… your seat might not be reserved anymore.”
The Old Barrier Is Now the New Test
That closed gap was acting like a reinforced ceiling. Buyers hitting their heads on it didn’t get far — until now. Trading above 2853.5 means the market is testing whether:
A close and hold above this zone is usually where early reversal logic starts to form.
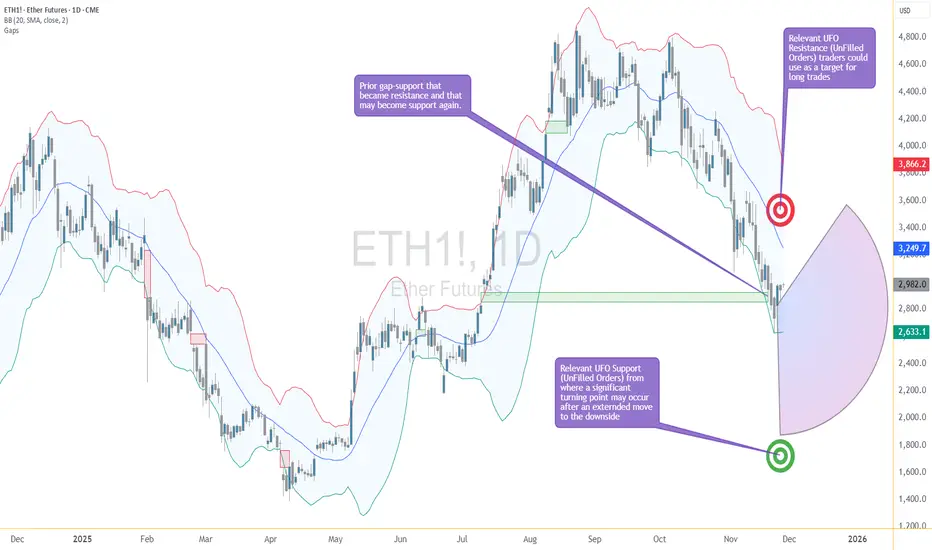
Next Target: UFO Resistance at 3376.5
If buyers keep control, the next structural “magnet” is near 3376.5, where a cluster of unfilled sell orders waits. Markets love revisiting old unfinished business, and this is the next shelf of potential friction.
It’s not a prediction — it’s just where the roadmap naturally leads once the gap breaks.
Support Below: The New Battleground
What used to be resistance is now a potential support zone. If price pulls back toward the gap’s top edge and stabilizes, it would confirm that buyers have actually taken the wheel.
If price slips back into the gap, then this “break” was just a false alarm — the chart equivalent of stepping on a stair that wasn’t actually there.
Two Quick Read-Through Scenarios
Scenario 1 — Reversal Gains Traction
This would suggest the downtrend is losing its grip.
Scenario 2 — Rejection Back Into the Gap
This would keep Ether in a broader corrective environment.
The key here is not guessing — it’s waiting to see whether the breakout holds.
Futures Traders Have Two Contract Sizes to Play With
Ether Futures (ETH) are the big, fast movers.
Micro Ether Futures (MET) offer the same chart logic, but at 1/500th the size, which makes scaling more controlled.
Whether large or micro, the structure is the same — only the sizing changes.
Quick Specs (Fast & Simple)
Bottom Line — The Story Just Got Interesting
For the first time in a while, Ether has stopped drifting and started acting. Breaking above the upper gap is the market’s first real sign of a potential power shift.
Now the question becomes simple:
Can buyers hold the line they just captured?
If yes → the path toward 3376.5 opens.
If no → the market falls back into its old bearish rhythm.
Either way, the quiet slide is over — this is where things get lively.
Want More Depth?
If you’d like to go deeper into the building blocks of trading, check out our From Mystery to Mastery trilogy, three cornerstone articles that complement this one:
When charting futures, the data provided could be delayed. Traders working with the ticker symbols discussed in this idea may prefer to use CME Group real-time data plan on TradingView: tradingview.com/cme/ - This consideration is particularly important for shorter-term traders, whereas it may be less critical for those focused on longer-term trading strategies.
General Disclaimer:
The trade ideas presented herein are solely for illustrative purposes forming a part of a case study intended to demonstrate key principles in risk management within the context of the specific market scenarios discussed. These ideas are not to be interpreted as investment recommendations or financial advice. They do not endorse or promote any specific trading strategies, financial products, or services. The information provided is based on data believed to be reliable; however, its accuracy or completeness cannot be guaranteed. Trading in financial markets involves risks, including the potential loss of principal. Each individual should conduct their own research and consult with professional financial advisors before making any investment decisions. The author or publisher of this content bears no responsibility for any actions taken based on the information provided or for any resultant financial or other losses.
For a while, ETH was sliding down the lower Bollinger Band like a chilled skier who forgot how to turn. Now? It just jumped over the fence.
This changes things. A gap break doesn’t guarantee a trend reversal, but it’s the market’s way of saying:
“Hey, sellers… your seat might not be reserved anymore.”
The Old Barrier Is Now the New Test
That closed gap was acting like a reinforced ceiling. Buyers hitting their heads on it didn’t get far — until now. Trading above 2853.5 means the market is testing whether:
- Sellers still have ammunition
- Buyers can hold the reclaimed turf
- Momentum is finally shifting gears
A close and hold above this zone is usually where early reversal logic starts to form.
Next Target: UFO Resistance at 3376.5
If buyers keep control, the next structural “magnet” is near 3376.5, where a cluster of unfilled sell orders waits. Markets love revisiting old unfinished business, and this is the next shelf of potential friction.
It’s not a prediction — it’s just where the roadmap naturally leads once the gap breaks.
Support Below: The New Battleground
What used to be resistance is now a potential support zone. If price pulls back toward the gap’s top edge and stabilizes, it would confirm that buyers have actually taken the wheel.
If price slips back into the gap, then this “break” was just a false alarm — the chart equivalent of stepping on a stair that wasn’t actually there.
Two Quick Read-Through Scenarios
Scenario 1 — Reversal Gains Traction
- ETH stays above 2853.5
- Buyers defend the reclaimed gap
- Market may gravitate toward 3376.5
This would suggest the downtrend is losing its grip.
Scenario 2 — Rejection Back Into the Gap
- ETH falls back below the gap ceiling
- Sellers reclaim control
- Market may return to prior support zones
This would keep Ether in a broader corrective environment.
The key here is not guessing — it’s waiting to see whether the breakout holds.
Futures Traders Have Two Contract Sizes to Play With
Ether Futures (ETH) are the big, fast movers.
Micro Ether Futures (MET) offer the same chart logic, but at 1/500th the size, which makes scaling more controlled.
Whether large or micro, the structure is the same — only the sizing changes.
Quick Specs (Fast & Simple)
- ETH contract: 50 Ether
- Tick: 0.25 per Ether = $12.50 per contract
- Margin: ≈ $44,000 (varies)
- MET contract: 1/500th of ETH (good for precision adjustments)
Bottom Line — The Story Just Got Interesting
For the first time in a while, Ether has stopped drifting and started acting. Breaking above the upper gap is the market’s first real sign of a potential power shift.
Now the question becomes simple:
Can buyers hold the line they just captured?
If yes → the path toward 3376.5 opens.
If no → the market falls back into its old bearish rhythm.
Either way, the quiet slide is over — this is where things get lively.
Want More Depth?
If you’d like to go deeper into the building blocks of trading, check out our From Mystery to Mastery trilogy, three cornerstone articles that complement this one:
- 🔗 From Mystery to Mastery: Trading Essentials
- 🔗 From Mystery to Mastery: Futures Explained
- 🔗 From Mystery to Mastery: Options Explained
When charting futures, the data provided could be delayed. Traders working with the ticker symbols discussed in this idea may prefer to use CME Group real-time data plan on TradingView: tradingview.com/cme/ - This consideration is particularly important for shorter-term traders, whereas it may be less critical for those focused on longer-term trading strategies.
General Disclaimer:
The trade ideas presented herein are solely for illustrative purposes forming a part of a case study intended to demonstrate key principles in risk management within the context of the specific market scenarios discussed. These ideas are not to be interpreted as investment recommendations or financial advice. They do not endorse or promote any specific trading strategies, financial products, or services. The information provided is based on data believed to be reliable; however, its accuracy or completeness cannot be guaranteed. Trading in financial markets involves risks, including the potential loss of principal. Each individual should conduct their own research and consult with professional financial advisors before making any investment decisions. The author or publisher of this content bears no responsibility for any actions taken based on the information provided or for any resultant financial or other losses.
🌟 Take This Analysis Further with Our AI Scripts 🎯 | Discover How at tradewithufos.com 🚀 Choose a Subscription: Monthly ᴼᴿ Yearly ᴼᴿ Lifetime 🗓️ | Unlock Intelligent UFO Scripts Free 💡
Powiązane publikacje
Wyłączenie odpowiedzialności
Informacje i publikacje nie stanowią i nie powinny być traktowane jako porady finansowe, inwestycyjne, tradingowe ani jakiekolwiek inne rekomendacje dostarczane lub zatwierdzone przez TradingView. Więcej informacji znajduje się w Warunkach użytkowania.