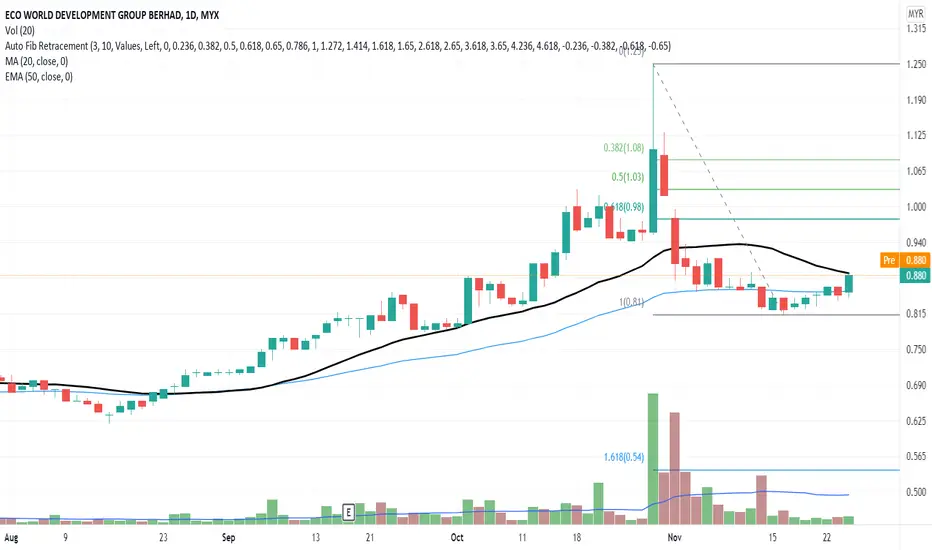
Using Fibonacci Retracement (FIBO) chart, the price indicates a continuous price uptrend momentum from the support line.
MACD and OBV charts indicate an early sign of divergence signal.
Therefore, it is in a good position to buy since it is below-the-market order and waits for the next significant price movement. Hence minimum the exposure risk from buying at peak price.
Put ECOWLD to your WL and watch out for significant price movement with volume or after the candlestick body crosses the MA20 line.
R 0.885
S 0.840
Powiązane publikacje
Wyłączenie odpowiedzialności
Informacje i publikacje przygotowane przez TradingView lub jego użytkowników, prezentowane na tej stronie, nie stanowią rekomendacji ani porad handlowych, inwestycyjnych i finansowych i nie powinny być w ten sposób traktowane ani wykorzystywane. Więcej informacji na ten temat znajdziesz w naszym Regulaminie.