DYDX is finally showing strong reversal signals after months of downtrend.
What’s happening?
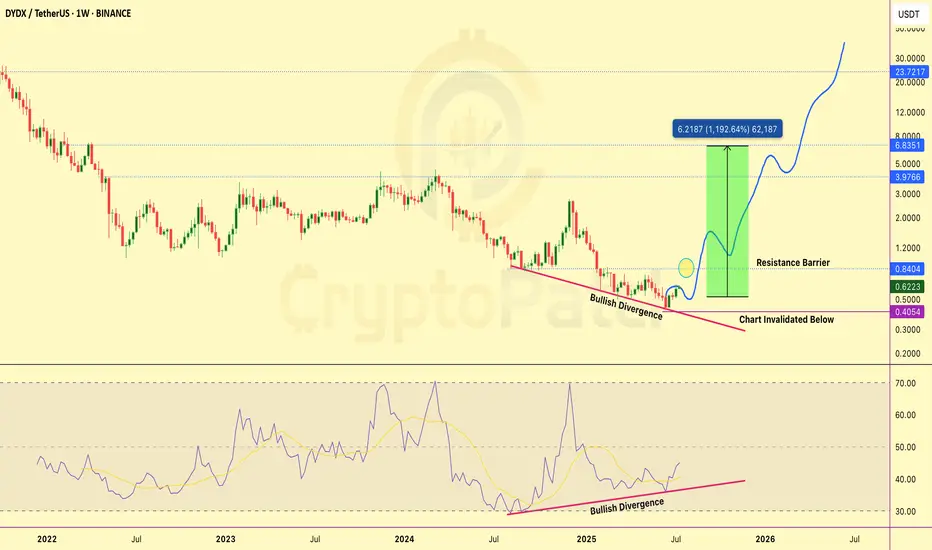
We’ve spotted a clear Bullish Divergence on both the price chart and RSI. While the price made lower lows, RSI is printing higher lows — a classic signal that selling pressure is weakening and buyers are stepping in quietly.
Key Levels to Watch:
🔹 Support (Invalidation Zone): $0.405
🔹 If price breaks below this level, the bullish setup is invalid.
🔹 Resistance Barrier: $0.84
Once DYDX closes above this level, a major breakout could unfold.
Upside Potential (if breakout confirmed): $0.84 / $3.97 / $6.83 / Bonus
RSI is also trending upward, confirming hidden strength in the move. Volume is gradually picking up too — another positive sign.
If this divergence plays out fully, we’re looking at a potential 10x+ move from here. Keep a close eye on the $0.84 breakout zone — it could be the ignition point for a major rally.
Always trade with SL and proper risk management.
This is NOT financial advice. Just sharing what I see on the charts.
What’s happening?
We’ve spotted a clear Bullish Divergence on both the price chart and RSI. While the price made lower lows, RSI is printing higher lows — a classic signal that selling pressure is weakening and buyers are stepping in quietly.
Key Levels to Watch:
🔹 Support (Invalidation Zone): $0.405
🔹 If price breaks below this level, the bullish setup is invalid.
🔹 Resistance Barrier: $0.84
Once DYDX closes above this level, a major breakout could unfold.
Upside Potential (if breakout confirmed): $0.84 / $3.97 / $6.83 / Bonus
RSI is also trending upward, confirming hidden strength in the move. Volume is gradually picking up too — another positive sign.
If this divergence plays out fully, we’re looking at a potential 10x+ move from here. Keep a close eye on the $0.84 breakout zone — it could be the ignition point for a major rally.
Always trade with SL and proper risk management.
This is NOT financial advice. Just sharing what I see on the charts.
Twitter: twitter.com/CryptoPatel
Telegram: t.me/OfficialCryptoPatel
Instagram: instagram.com/cryptopatel?utm_medium=copy_link
Telegram: t.me/OfficialCryptoPatel
Instagram: instagram.com/cryptopatel?utm_medium=copy_link
Wyłączenie odpowiedzialności
Informacje i publikacje przygotowane przez TradingView lub jego użytkowników, prezentowane na tej stronie, nie stanowią rekomendacji ani porad handlowych, inwestycyjnych i finansowych i nie powinny być w ten sposób traktowane ani wykorzystywane. Więcej informacji na ten temat znajdziesz w naszym Regulaminie.