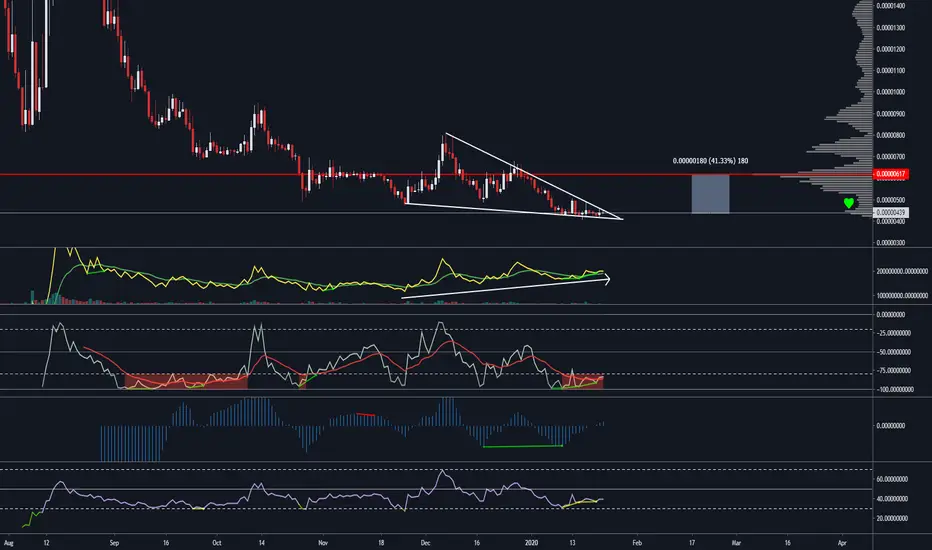
DUSK is setting up for a nice trade despite the bearish market structure. Can the bulls push it up higher? I think it's possible.
My reasoning:
Falling wedge pattern (stockcharts): school.stockcharts.com/doku.php?id=chart_analysis:chart_patterns:falling_wedge_reversal
Hit the LIKE button if you find my analysis valuable and want to support me. Follow to make sure you don't miss any future trade ideas.
My reasoning:
- Structure: Falling wedge chart pattern getting very tight.
- Divergence: Confirmed div in histogram , divs in willy and RSI.
- Volume: OBV is strong, showing a lot more buyers than sellers despite the falling price. Divergence since late November.
- VPVR: Below the POC, however the notch above coupled with the strong volume coming in I think we can fill it.
Falling wedge pattern (stockcharts): school.stockcharts.com/doku.php?id=chart_analysis:chart_patterns:falling_wedge_reversal
Hit the LIKE button if you find my analysis valuable and want to support me. Follow to make sure you don't miss any future trade ideas.
Zlecenie aktywne
Transakcja zakończona: osiągnięto poziom stop
The answer is no! Despite the incredibly bullish setup, there was absolutely no follow through and we lost support once BTC started gaining momentum. An altcoin trader's life ;-)Wyłączenie odpowiedzialności
Informacje i publikacje przygotowane przez TradingView lub jego użytkowników, prezentowane na tej stronie, nie stanowią rekomendacji ani porad handlowych, inwestycyjnych i finansowych i nie powinny być w ten sposób traktowane ani wykorzystywane. Więcej informacji na ten temat znajdziesz w naszym Regulaminie.
Wyłączenie odpowiedzialności
Informacje i publikacje przygotowane przez TradingView lub jego użytkowników, prezentowane na tej stronie, nie stanowią rekomendacji ani porad handlowych, inwestycyjnych i finansowych i nie powinny być w ten sposób traktowane ani wykorzystywane. Więcej informacji na ten temat znajdziesz w naszym Regulaminie.