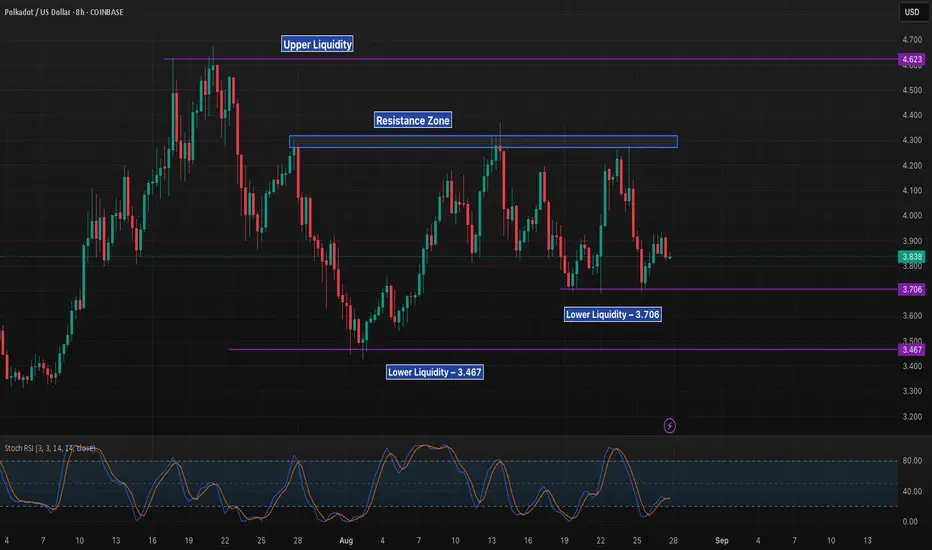
Polkadot is trading in a defined range, capped by resistance at $4.20–$4.30 and supported between $3.70 and $3.46. These liquidity levels have repeatedly shaped recent price action.
Bullish path: A breakout above resistance could target the $4.62 liquidity level.
Bearish path: Losing $3.70 risks a sweep of $3.46 liquidity and possible continuation lower.
Stoch RSI is rising from oversold territory, but confirmation will require strength above resistance. Until then, DOT remains trapped in consolidation between these key zones.
Explore 5,000 Strategies at quanttradingpro.com
Search for the most profitable, lowest risk by symbol!
Search by indicators like Supertrend, Ichimoku, macd.
Join our discord discord.gg/2systG9frc
We provide education & tools.
Search for the most profitable, lowest risk by symbol!
Search by indicators like Supertrend, Ichimoku, macd.
Join our discord discord.gg/2systG9frc
We provide education & tools.
Wyłączenie odpowiedzialności
Informacje i publikacje przygotowane przez TradingView lub jego użytkowników, prezentowane na tej stronie, nie stanowią rekomendacji ani porad handlowych, inwestycyjnych i finansowych i nie powinny być w ten sposób traktowane ani wykorzystywane. Więcej informacji na ten temat znajdziesz w naszym Regulaminie.